
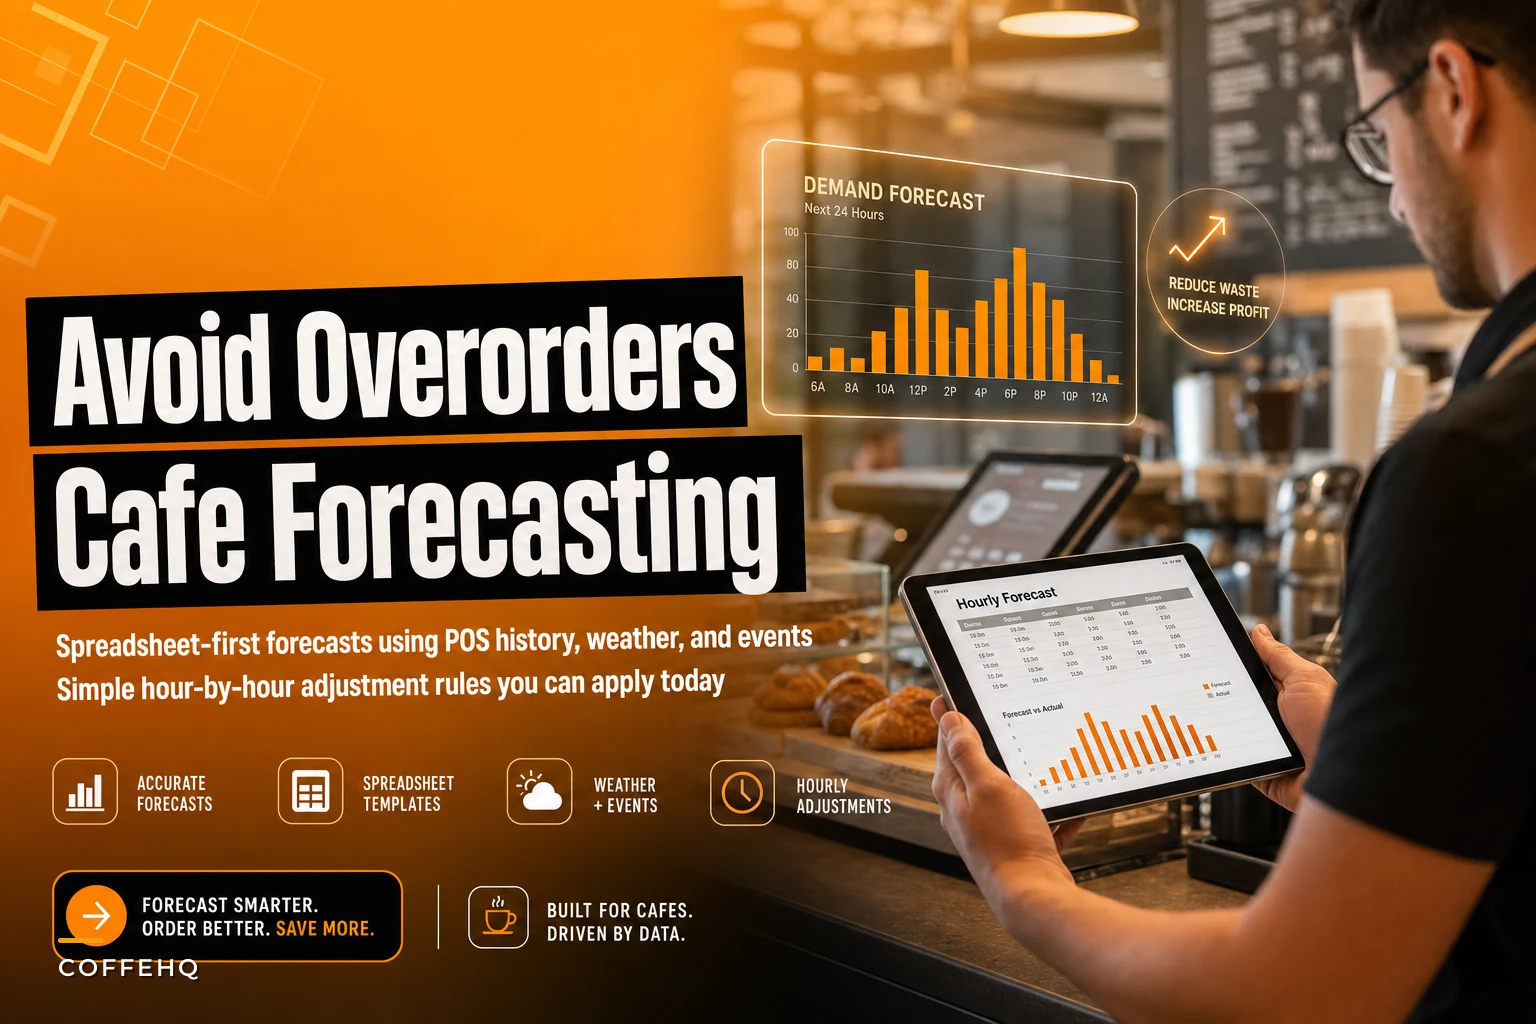

That Thursday morning when you opened three boxes of oat milk and realized you already had seven in the walk-in? Yeah, that wasn't just a bad morning—it was probably a $280 mistake that happens because most cafe owners forecast demand the same way they learned to pull shots: by feel.
After watching hundreds of cafe owners struggle with inventory, the pattern becomes obvious. They either order based on last week's numbers (which ignores that concert happening Saturday), or they panic-order everything because running out seems worse than overordering. Both approaches bleed money.
The worst part is watching owners try enterprise forecasting software that costs $400/month and requires three hours of training just to understand the dashboard. Most cafes don't need machine learning algorithms—they need a spreadsheet that actually makes sense at 5 AM when you're placing orders.
Why your current "system" keeps failing
Most cafe owners build their ordering around one flawed assumption: that next week will look like last week. This works fine until it doesn't.
Take a cafe I worked with near a university. Their owner kept ordering based on semester averages, completely missing that finals week cuts traffic by 60% while move-out week spikes demand by 40%. Every transition cost them either spoiled product or angry customers facing empty pastry cases.
Weather makes it worse. One Portland cafe discovered they were losing $1,800 monthly because they never adjusted milk orders for rainy days, when hot coffee sales jump 35% and iced drinks drop by half. Their baristas knew this intuitively—customers literally tell them "finally, a day for hot coffee"—but nobody translated that knowledge into purchasing decisions.
Local events create similar chaos. A cafe near a convention center would regularly run out of everything during trade shows because they relied on their standard Wednesday order quantities. Meanwhile, during quiet weeks, they'd throw away bags of spoiled spinach from their breakfast sandwich prep.
All this data already exists. Your POS system tracks every transaction. Your weather app shows the forecast. The city website lists every permitted event. But without a system to combine these inputs, you're essentially driving blindfolded.
Building templates that match reality
The most effective forecasting starts with understanding your baseline demand patterns. Not the averages you think you know—the actual hour-by-hour flow of your business.
Keep every order and shift perfectly aligned.
Coffehq helps you manage orders, inventory, and staff schedules seamlessly.
- Unified order processing
- Real-time inventory updates
- Staff shift coordination
No credit card required
Start by exporting your POS data for the past eight weeks. You want transaction counts and product mix by hour, not just daily totals. Most Square or Toast users can pull this in about five minutes. Create columns for day of week, hour, weather (sunny/cloudy/rain), and any notable events.
Most templates fail because they treat Tuesday at 7 AM the same as Tuesday at 2 PM. But your morning rush needs completely different prep than your afternoon slump. A functional template breaks your day into demand blocks:
-
Opening rush (6-9 AM)
-
Morning cruise (9-11 AM)
-
Lunch spike (11
30 AM-1:30 PM)
-
Afternoon lull (2-4 PM)
-
After-school/work bump (4-6 PM)
-
Evening wind-down (6 PM-close)
For each block, track your typical sales velocity. Not averages—actual counts from real days. If you typically sell 45 lattes during morning rush on sunny Tuesdays, that's your baseline. Rainy Tuesday? Check your data—probably closer to 55.
The template structure itself should be simple enough to update from your phone while doing morning prep. Three sheets maximum:
-
Daily forecast (next 7 days)
-
Hourly breakdown (tomorrow only)
-
Adjustment rules
That adjustment rules sheet becomes your secret weapon. Instead of remembering that construction on Main Street cuts morning traffic by 20%, you document it once. Instead of guessing how much that monthly art walk boosts evening espresso sales, you measure it and record the multiplier.
Document local modifiers once in the adjustment rules sheet so you stop guessing during morning prep.
A simple workflow helps turn POS exports into usable daily and hourly forecasts.
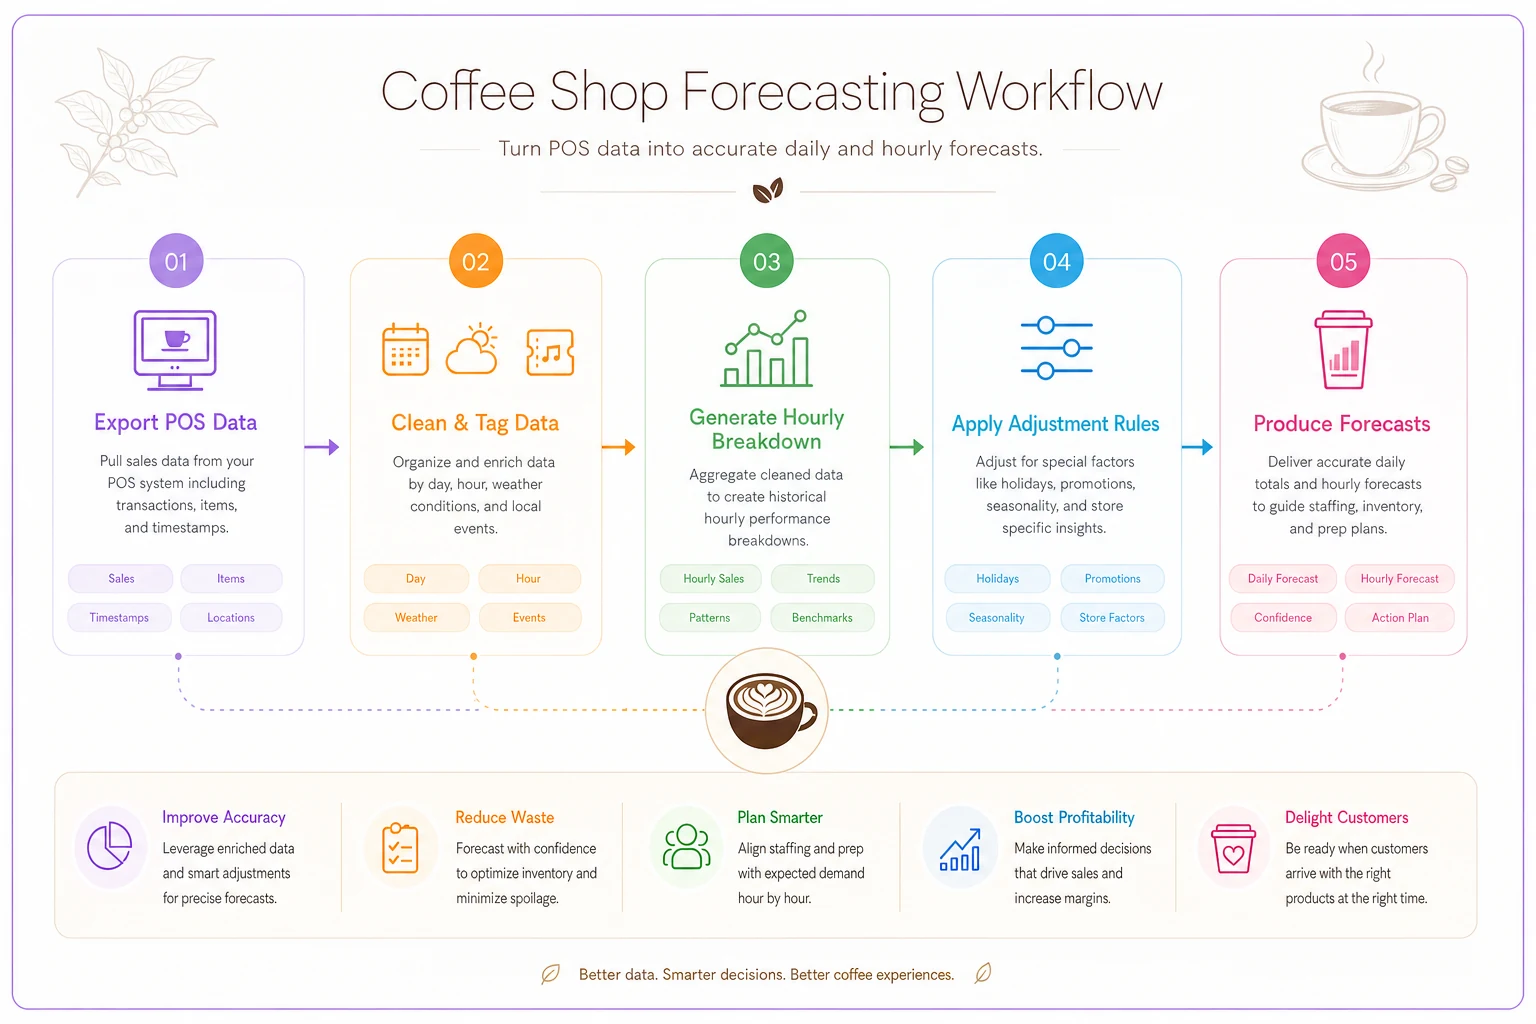
Keep the workflow simple and repeatable so you can update it quickly from your phone.
Instead of remembering rules in your head, write them down and measure their impact. That makes your template a living tool, not a guess.
Weather adjustments that make sense
Weather impacts aren't just about rain versus sun. Temperature swings matter more than most owners realize.
One Chicago cafe tracked their sales against weather for a full year and discovered that the first sunny day after three days of rain increased afternoon iced coffee sales by 70%. Not sunny days in general—specifically that first nice day after bad weather. Their template now flags these transition days automatically.
Temperature breakpoints vary by market, but common patterns emerge:
-
Below 45°F
Hot drink sales increase 25-40%
-
Above 75°F
Iced drinks jump 50-65%
-
First day above 80°F
Iced drinks can double
-
Rain after five sunny days
Hot drinks spike 30%
What actually matters: your customers' perception of weather, not the actual temperature. The first 65-degree day in March drives different behavior than the same temperature in October. Your template needs seasonal adjustment factors, not just temperature rules.
Wind matters too, especially for grab-and-go locations. Strong wind drops walk-up traffic by around 20% but barely affects drive-through if you have one. One Denver cafe started checking wind speeds after noticing their plaza location became a wind tunnel certain afternoons, killing their patio sales.
Local event multipliers
Events don't affect all cafes equally. A marathon might triple sales for a cafe on the race route while barely touching one three blocks away.
Map your event impacts by category:
Major traffic drivers:
-
Concerts/festivals within 3 blocks
2.5-3x evening demand
-
Sporting events
2x demand 2 hours before, 1.5x after
-
Conferences
1.8x morning demand, dead afternoons
Moderate impacts:
-
Street fairs
1.5x all day if you're visible from the fair
-
School events
1.3x afternoon bump
-
Gallery openings
1.4x evening espresso/pastry
Surprise killers:
-
Parades that block your street
-60% during parade hours
-
Construction/filming
-30% all day
-
Holiday shopping days
+40% afternoon but -20% morning
| Event | Impact |
|---|---|
| Concerts/festivals within 3 blocks | 2.5-3x evening demand |
| Sporting events | 2x demand 2 hours before, 1.5x after |
| Conferences | 1.8x morning demand, dead afternoons |
| Parades that block your street | -60% during parade hours |
| Construction/filming | -30% all day |
| Street fairs | 1.5x all day if you're visible from the fair |
Track radius of impact. A 5K race affects you differently if you're at the start line versus along the route. Your template needs geographic modifiers, not just event flags.
Hour-by-hour adjustment rules
Static forecasts assume your day flows predictably. Reality laughs at this assumption.
Your template needs dynamic adjustment triggers. If your 7 AM hour runs 20% above forecast, your 8 AM hour probably will too—morning rushes tend to shift as blocks, not spread evenly. Build in cascade rules: "If 7 AM exceeds forecast by X%, increase 8 AM forecast by X*0.7%."
Some patterns to encode:
Morning cascade: Strong 6 AM predicts strong 7-8 AM
Lunch compression: Busy 11:30 means slammed 12-12:30
Afternoon void: Dead 2 PM usually means dead until 3:30
Evening bump: After-work rush either happens at 4:30 or 5:30, rarely both
Watch for inverse relationships too. Extremely busy morning hours often predict slower afternoons—people got their coffee fix early. Dead mornings can mean desperate afternoon catches when people finally escape meetings.
Pre-close patterns need special attention. If you're dead at 6 PM, you're probably dead until close. But one busy table at 6:30 often triggers a cascade of "oh, they're still open" traffic. Your template should flag these pivot points.
Testing without risking waste
Nobody trusts a new system immediately, especially when ordering mistakes mean either angry customers or thrown-away product.
Run shadow forecasts for two weeks before changing any ordering. Keep ordering normally but track what your template would have recommended. Every day, note the variance. Where did the template nail it? Where did it miss? More importantly—why did it miss?
Common early mistakes:
-
Forgetting holiday Mondays behave like Sundays
-
Missing that school breaks change morning patterns
-
Not accounting for seasonal menu changes
-
Ignoring construction/road work impacts
After two weeks of shadow tracking, implement gradually. Start with stable items like coffee beans and cups. These have longer shelf lives, so minor forecasting errors won't hurt. Once you trust those predictions, add milk and pastries. Fresh produce and prepared items come last.
Track variance religiously. Your template should include an accuracy tracker—actual versus predicted for each major category. Anything consistently off by more than 15% needs rule adjustment. Don't just tweak multipliers randomly; understand why the variance exists first.
Reading patterns before they're obvious
Good templates don't just track history—they spot trends before they become problems.
Build in momentum tracking. If this Monday was 10% above last Monday, and last Monday was 10% above the one before, you're in a growth pattern. Your template should project that forward, not just average the weeks.
Seasonal patterns hide in plain sight. That gradual decline in afternoon iced coffee sales starting in late August? It's not random—it's back-to-school parent schedule changes. Your September template should anticipate this, not discover it weekly.
Watch for leading indicators:
-
Foot traffic changes before sales changes
-
Morning sales predict afternoon trends
-
Weekend patterns preview weekday shifts
-
Social media buzz precedes event impacts
One Berkeley cafe noticed their Instagram engagement predicted next-day traffic with surprising accuracy. High engagement on morning posts meant 20% higher afternoon sales. They added a social metrics input to their template—crude but effective.
When to ignore your template completely
Templates fail during true anomalies. Don't try to forecast:
-
First week after major construction starts
-
Grand opening of competitor next door
-
Your own menu overhauls
-
Extreme weather events
-
Major local employer changes
During these periods, order conservatively and track actuals obsessively. You're collecting data for next time, not trying to predict chaos.
Some owners make their templates too complex, adding variables until Excel runs slowly. If updating takes more than five minutes, you've overengineered. The goal is sustainable daily use, not perfect prediction.
Templates supplement judgment, not replace it. When your experienced barista says "feels like a busy afternoon coming," they might be reading signals your spreadsheet can't capture. Build in override capabilities but track when and why you override. Those patterns become tomorrow's rules.
Moving from reactive to predictive
The real power of simple cafe forecasting isn't just avoiding waste—it's the compound effect of consistent optimization.
When you stop overordering milk by 20%, that's immediate savings. But when your team stops spending 30 minutes every morning shuffling inventory to make space for excess deliveries, that's recovered productivity. When your baristas stop running out of oat milk during afternoon rush, that's preserved customer trust.
Good forecasting templates grow smarter over time. Every week adds data. Every season teaches patterns. Every event becomes a future reference point. After six months, your simple spreadsheet will outperform expensive software because it's trained on your specific reality, not industry averages.
More sophisticated operators eventually want to connect these templates to automated ordering systems. Modern POS systems can export data automatically, weather APIs can feed forecasts directly, and event calendars can sync with your spreadsheet. But even basic manual templates beat gut-feeling ordering if you commit to daily updates.
The ultimate test: can someone else run your forecasting if you're sick? If your system lives entirely in your head, you don't have a system. But if your templates clearly document patterns and rules, you've built true operational value into your business.
Start simple. Track religiously. Adjust constantly. Your perfect forecast doesn't exist, but your next forecast can be better than your last one. In the cafe business, those incremental improvements compound into competitive advantages faster than most owners realize.
Ready to brew operational excellence?
Join hundreds of coffee shops using Coffehq to boost efficiency, reduce waste, and elevate customer satisfaction.