


Last week, I watched a barista make the same vanilla latte four times. Not because she messed up the recipe, but because she had to walk sixteen steps round-trip between the espresso machine and the syrup station. By the third remake, the milk had cooled, the shot had died, and she had to start over.
The owner blamed the barista. Classic mistake.
After mapping her movements for just one morning rush, we discovered she was walking almost 2 miles during a 4-hour shift. Not because she was inefficient—because every tool she needed lived in a different zip code.
This happens in roughly 70% of coffee shops. The stations evolve organically as equipment gets added, menu items expand, and different baristas create their own "systems." Nobody notices the inefficiency until drink times stretch past 4 minutes and the morning line snakes out the door.
The hidden geometry of speed
Most coffee shop owners think barista speed comes from training and muscle memory. That matters, but station geometry determines about 60% of drink production time.
Watch your slowest drinks. The ones that always bottleneck during rush hour. Count the steps your baristas take. Count the reaches. Count the times they turn their bodies more than 45 degrees. Every unnecessary movement compounds. A poorly placed milk pitcher adds 2 seconds. Syrup pumps on the wrong side of the counter add 3 seconds. That's 5 extra seconds per drink. During a 90-drink morning rush, you've added 7.5 minutes of pure waste. Your customers feel every one of those minutes. Your baristas adapt. They develop workarounds, create personal stashes of supplies, and muscle through the inefficiency. They make it work, which masks the underlying problem.
Mapping the reality (not the theory)
Before touching anything in your station, you need to see what's actually happening. Not what you think happens, not what the training manual says—what physically occurs during a busy shift. Grab a clipboard and sketch your current station layout. Mark every piece of equipment, every supply location, every tool. Now pick your busiest hour tomorrow morning and track one barista:
Keep every order and shift perfectly aligned.
Coffehq helps you manage orders, inventory, and staff schedules seamlessly.
- Unified order processing
- Real-time inventory updates
- Staff shift coordination
No credit card required
-
Draw their movement path for 10 drinks
-
Mark where they pause or wait
-
Note every time they backtrack
-
Count steps for common drinks
Use your phone's pedometer to get an easy step count for a full shift.
The patterns emerge fast. You'll see the triangle between espresso machine, milk station, and syrup pumps. You'll notice the dead zones where nothing useful lives. You'll spot the collision points where baristas bump into each other. One shop in Denver discovered their baristas were crossing paths 47 times per hour during morning rush. Each crossing meant someone had to pause, step aside, or wait. Those micro-delays added up to 12 minutes of lost production per hour.
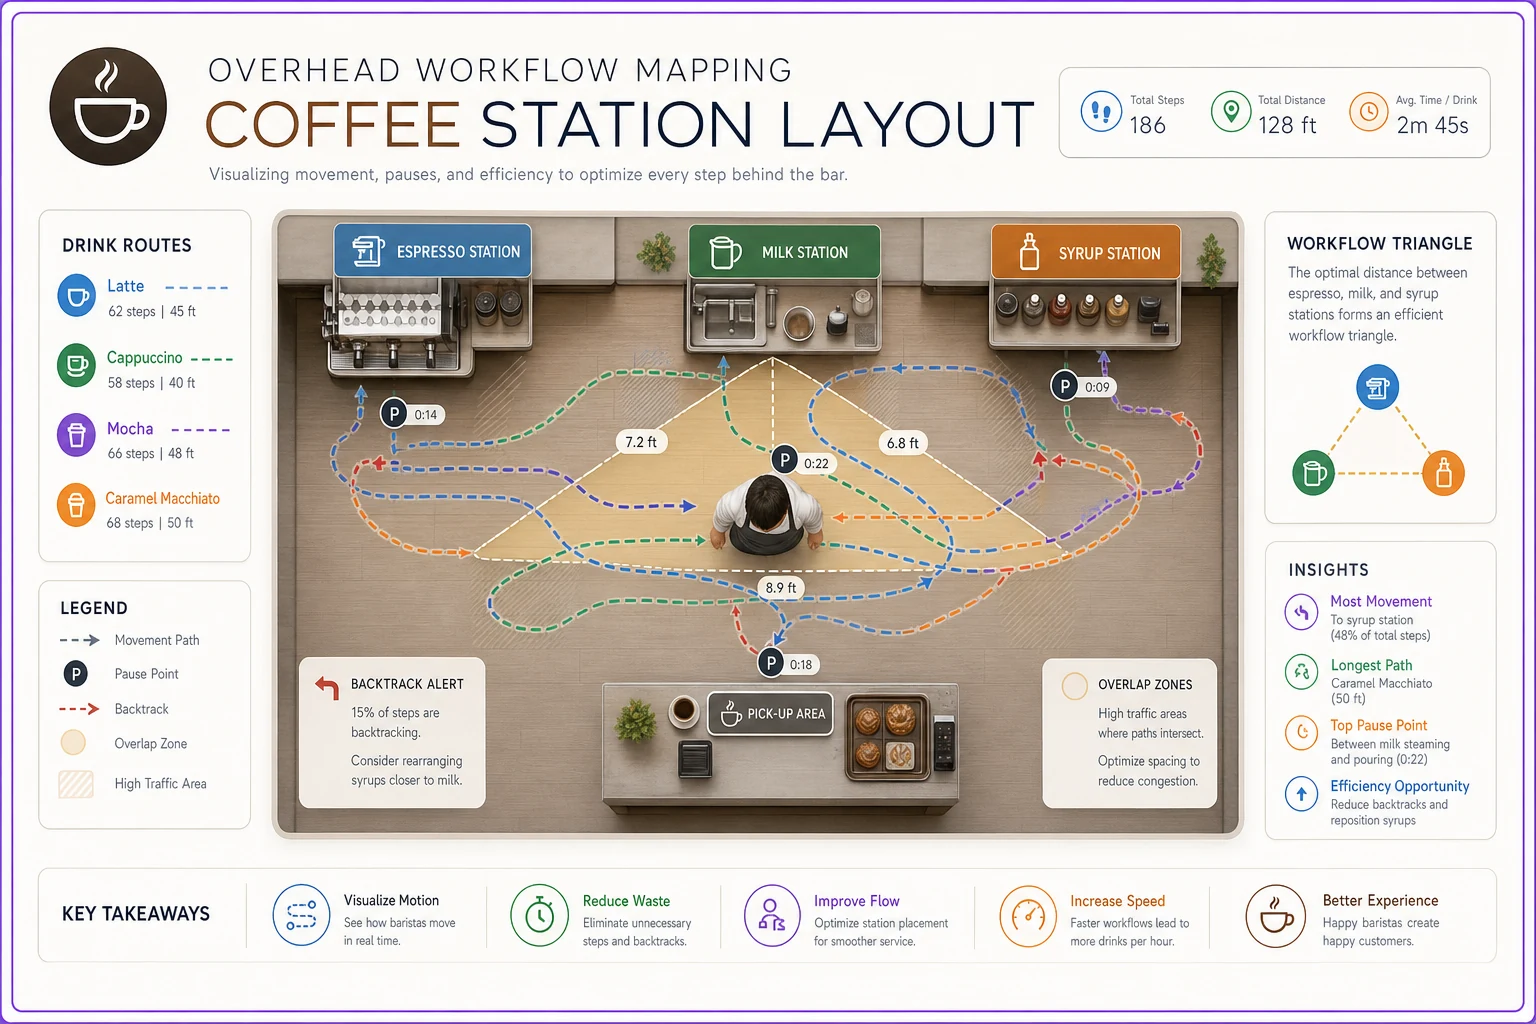
A quick visual makes the flow obvious and helps convince staff to try changes for a week.
The three zones that actually matter
Successful layouts always respect three distinct work zones:
Zone 1: Espresso production Everything for pulling shots lives here. Grinder, tamper, portafilters, cleaning cloths. The barista should be able to clean, dose, tamp, and pull without moving their feet. Zone 2: Milk and mixing Steam wands, milk pitchers, thermometers, alternative milks. This zone overlaps slightly with espresso production since most machines combine both functions. But milk supplies and backup pitchers need their own dedicated space within arm's reach. Zone 3: Assembly and handoff Syrups, sauces, toppings, cups, lids. This is where drinks come together and meet customers. It's also where most layouts fail—forcing baristas to carry hot drinks across the entire counter to add finishing touches. The magic happens when these zones flow into each other naturally. Espresso flows into milk, milk flows into assembly, assembly flows to customer. Linear when possible, clustered when space is tight.
Real layout transformations that worked
The Compact Corner Setup A 400-square-foot shop in Portland had their espresso machine against the back wall, syrups on the side counter, and pastry case blocking the handoff area. Drinks took 5-6 minutes during rush.
We rotated the entire station 90 degrees. Espresso machine moved to the corner, angled at 45 degrees. Syrups relocated to a swing-arm mount next to the steam wand. Handoff zone shifted to the short wall, directly connected to the POS.
Results after two weeks:
-
Average drink time
3.5 minutes
-
Morning rush capacity
85 drinks/hour (up from 65)
-
Barista movement
reduced by roughly 40%
-
Zero increase in mistakes or remakes
Total cost: $340 for the swing-arm mount and some shelf brackets.
The Two-Barista Flow Fix A busy shop near a college campus had two baristas constantly colliding. Both needed access to the same grinder, same syrups, same milk fridge. They literally choreographed their movements to avoid crashes.
Instead of one shared station, we created two parallel tracks:
-
Barista A
Espresso and hot drinks
-
Barista B
Cold drinks and food
Each track had dedicated tools. No sharing, no crossing, no waiting. We duplicated only the essential items—a second milk pitcher set, a second syrup rail, a second tamper.
The investment: about $800 for duplicate tools and a small refrigerator for the cold drink station.
The payoff:
-
25% increase in hourly drink output
-
Customer wait time dropped from 8 minutes to 5 minutes during peak hours
-
Tips increased by roughly $40 per day (faster service = happier customers)
The Compact Corner and Two-Barista examples show small investments can unlock big capacity gains.
Tool placement rules that actually speed things up
Forget aesthetic organization. Place tools based on frequency and handedness.
The frequency rule: Track which tools you touch most often during a shift. Those live in the prime real estate—between hip and shoulder height, within 18 inches of the primary work position. Everything else gets pushed to the edges. Most used items (every drink): Portafilters, steam pitchers, shot glasses Frequently used (every 3-5 drinks): Popular syrups, cleaning towels, thermometers Occasionally used (every 10+ drinks): Specialty syrups, flavor powders, special tools
The handedness rule: Watch which hand your baristas favor. Right-handed baristas naturally reach right for tools. Fighting this instinct slows everything down.
-
Portafilters on the right side of the grinder
-
Milk pitchers right of the steam wand
-
Most-used syrups on the right side of the rail
Reverse everything for left-handed baristas. Mixed crew? Put duplicates on both sides for the critical tools.
The motion economy rule: Every tool should support the natural flow of drink-making. Motions should arc, not zigzag. Think about the journey of a latte: Grind → dose → tamp → insert → pull → steam → pour → top → serve Each step should flow into the next without backtracking, reaching across the body, or changing levels unnecessarily.
The measurements that prove ROI
Owners want to see numbers before moving equipment around. Here's what to measure before and after any station redesign:
Baseline metrics (one week before changes):
-
Average drink production time
-
Drinks per hour during peak times
-
Number of remakes per shift
-
Barista step count (phone apps work fine)
-
Customer wait time from order to receive
Post-change metrics (one week after):
-
Same measurements
-
Plus
barista feedback on fatigue
-
Plus
customer complaints or compliments
A shop in Austin made these simple changes:
-
Moved syrups from back counter to side rail ($45 for mounting hardware)
-
Raised the knock box 6 inches ($20 platform)
-
Added a second tamper station ($35 for tamper and mat)
Their measurements:
| Metric | Before | After | Improvement |
|---|---|---|---|
| Avg drink time | 4.2 min | 3.4 min | 19% faster |
| Peak hour output | 72 drinks | 86 drinks | 19% increase |
| Daily remakes | 8-10 | 3-4 | 60% reduction |
| Barista steps/shift | ~8,000 | ~5,800 | 27% reduction |
That $100 investment generated roughly $280 per week in additional revenue from faster service and increased capacity during rush periods. ROI in under a week.
When not to optimize your barista station
Some situations make station optimization pointless or even harmful:
Your menu is the real problem If you offer 47 different drinks with wildly different prep methods, station layout won't fix your speed issues. Simplify the menu first.
Your equipment is failing A dying espresso machine that takes 45 seconds to pull a shot won't get faster with better placement. Fix or replace broken equipment before optimizing layout.
Your volume doesn't justify it Serving 30 drinks per day? Speed probably isn't your bottleneck. Focus on quality and customer experience instead.
You're about to relocate or renovate Major changes coming in the next 3 months? Save the optimization energy for the new space.
The small changes that matter most
Height adjustments Raise or lower work surfaces to match your baristas' elbow height. Hunching or reaching up dozens of times per shift destroys speed and backs. A few wooden blocks or adjustable feet can fix this for under $20.
Duplicate the basics
-
Second tamper
$30
-
Extra milk pitchers
$15 each
-
Backup thermometer
$12
-
Additional knock box
$25
Having duplicates eliminates waiting and lets baristas maintain flow during busy periods.
Create defined zones with tape Before investing in permanent changes, use colored tape to mark zones on your counter. Test different layouts for a week each. The tape costs $5 and prevents expensive mistakes.
Install hooks and rails Vertical storage keeps counters clear and tools accessible. Magnetic knife strips hold metal tools. S-hooks on rails hold pitchers and towels. Rail systems run about $30-50 per linear foot.
Maintaining speed as drink complexity grows
Every new menu item threatens to slow down your optimized station. That seasonal lavender oat milk cortado might excite customers, but it adds steps, requires new tools, and breaks your carefully designed flow.
Create a seasonal zone Dedicate one small section to rotating ingredients and tools. This zone sits slightly outside the main flow, accessible but not in the way. When pumpkin spice season hits, everything needed lives in this one spot.
Build modular storage Fixed shelves lock you into one configuration. Adjustable shelving, magnetic containers, and rail-mounted organizers let you reconfigure as needs change. The extra $200-300 for modular storage pays off the first time you add a new drink category.
Test in small batches Before adding any new drink permanently, run it as a special for one week. Watch how it impacts station flow. Where do baristas struggle? What tools need relocating? Adjust before committing.
Beyond physical layout: the operational side
Even the best station design fails without supporting operational systems. The physical layout enables speed, but procedures and training deliver it.
Standard drink-building sequences Every barista should build drinks in the same order. Not because one way is "right," but because consistency prevents collision and confusion. When everyone follows the same sequence, multiple baristas can work the same station without thinking about coordination.
Prep responsibilities Speed during rush depends on prep before rush. Who refills syrups? When do milk supplies get restocked? Who cleans steam wands between drinks? Clear ownership of these tasks prevents the mid-rush scramble that kills momentum.
The handoff protocol The connection between barista and customer at drink handoff affects perceived speed more than actual production time. A clear handoff zone, consistent drink announcement, and smooth exchange makes 4-minute production feel faster than chaotic 3-minute production.
AI-powered operational software helps coordinate these moving parts. Instead of sticky notes and verbal reminders, automated task assignments ensure prep happens on schedule. Digital drink recipes maintain consistency across shifts. Real-time performance tracking identifies when certain stations or sequences slow down, letting you adjust before problems become patterns.
The physical station optimization gets you halfway there. The operational framework—whether managed through experience, training, or AI-enhanced systems—completes the speed equation while maintaining the quality your customers expect.
Making the investment decision
You've measured your current performance. You've identified the bottlenecks. Now comes the investment decision.
Start with the math: Calculate your average transaction value and current hourly capacity during peak times. If you're serving 60 drinks per hour at $5.50 average, that's $330 per peak hour. Increasing capacity to 75 drinks per hour adds $82.50 per peak hour. Over a month of morning rushes, that's roughly $2,500 in additional revenue.
But the real value goes beyond direct revenue:
-
Reduced barista fatigue means lower turnover
-
Faster service improves customer satisfaction and retention
-
Consistent drink times enable better labor scheduling
-
Less physical strain reduces injury risk and sick days
Most station optimizations pay for themselves within 2-4 weeks through a combination of increased sales and reduced operational friction.
Successful shops treat station design as an ongoing process, not a one-time project. They measure, adjust, and refine based on real data and barista feedback. They recognize that every menu change, equipment upgrade, or volume shift creates new optimization opportunities.
Your baristas want to work efficiently. Your customers want their drinks quickly. Your station design is either enabling or preventing both outcomes. The distance between those two realities is usually just a few feet and a few hundred dollars of strategic investment.
Ready to brew operational excellence?
Join hundreds of coffee shops using Coffehq to boost efficiency, reduce waste, and elevate customer satisfaction.