


Staring at your POS reports at midnight, watching food costs creep up month after month with no clue who should fix it or where to start? Every independent cafe owner I've worked with goes through this in their first three years.
The issue isn't that cafe owners don't track metrics. Any halfway-organized coffee shop has spreadsheets with daily sales, maybe some labor percentages, probably a dusty binder with last year's P&L. The real problem is nobody knows what to actually DO with these numbers. Your shift supervisor sees milk waste is high — but is that their problem or the owner's? Labor hits 38% one week — who decides whether to cut hours or ride it out?
Most independent cafes don't need more dashboards or fancier reports. They need an operational framework that connects metrics to specific people, clear decision rules, and testable experiments. Not enterprise-level nonsense with 47 KPIs and a dedicated analyst — but a practical system that works when you've got six employees and you're still pulling shots on busy mornings.
The disconnect between tracking and acting
What typically happens in a 2-location cafe doing around $1.8M annually: The owner pulls reports every week, maybe shares them in a team meeting, everyone nods, then... nothing changes. Numbers go up, numbers go down, but there's no connection between what gets measured and what gets done.
I watched this at a specialty coffee shop in Portland last year. Beautiful dashboards showing everything from hourly transaction counts to individual product margins. When afternoon sales started dropping, it took four months to figure out their opening barista was consistently running out of popular pastries by 2pm because nobody was assigned to monitor and reorder mid-day inventory. The data was all there — they just didn't have a system for who should look at what and when to take action.
The framework that works for independent cafes breaks down into four components most shops completely miss:
Role-specific metric ownership. Your barista team lead shouldn't worry about rent ratios, and your owner shouldn't track individual drink remake percentages. Each operational level needs their own focused set of 3-4 metrics they can actually influence.
Trigger points that automatically initiate action. Not vague goals like "improve efficiency" but specific thresholds like "when remake rate exceeds 3% for two consecutive days, implement the verification protocol."
A simple experiment runbook. When something's off, you need a repeatable process for testing solutions without disrupting your entire operation. Most cafes randomly change things and hope for the best.
Decision rules that don't require a meeting every time. If waste exceeds X, do Y. If customer wait time hits Z during peak, implement protocol A. No committees, no analysis paralysis.
Building your metric ownership matrix
The biggest shift: moving from "the owner tracks everything" to "everyone owns something specific." In a typical 8-person cafe team, this breaks down into three operational levels, each with distinct responsibilities and metrics.
Keep every order and shift perfectly aligned.
Coffehq helps you manage orders, inventory, and staff schedules seamlessly.
- Unified order processing
- Real-time inventory updates
- Staff shift coordination
No credit card required
Shift-level metrics (owned by baristas and shift leads)
Your front-line team should own immediate operational metrics they can directly control during their shift. This isn't about making baristas into analysts — it's about giving them ownership of numbers that reflect their actual work.
Transaction speed is obvious. But instead of some abstract "efficiency score," track specific bottleneck points: time from order to handoff, remake frequency, and void percentage. Things a barista can fix in real-time by adjusting workflow or calling for backup.
Station waste tracking becomes powerful when owned at the shift level. Each station (espresso, cold bar, food prep) tracks their own waste in actual dollars, not percentages. When the closing shift sees they tossed $47 worth of milk and syrups, that hits different than seeing "waste: 2.3%."
The shift lead owns hourly labor efficiency — not in percentage terms, but transactions per labor hour. When it drops below your threshold (usually around 15-20 transactions per person per hour), they have authority to adjust positions or call in backup without asking permission.
Daily operation metrics (owned by managers)
Your manager or assistant manager layer owns daily operational health metrics that require pattern recognition across shifts. They're looking at trends, not individual transactions.
Product mix variance tells you when your menu is getting lopsided. If espresso drinks drop below 60% of beverage sales for three consecutive days, that's a training issue or menu positioning problem needing immediate attention.
Daily margin tracking by category (beverages, food, retail) helps catch pricing or portioning issues before they compound. Your manager should know target margins for each category and have authority to adjust when they drift more than 2% from target.
The manager layer also owns demand-to-labor alignment. They're comparing forecasted traffic (based on historical patterns) to actual scheduling, with authority to adjust the next day's deployment.
Strategic metrics (owned by the owner)
The owner focuses on bigger picture metrics that drive long-term profitability. These typically get reviewed weekly, not daily.
Customer lifetime value vs. acquisition cost is huge for independent cafes but rarely tracked properly. How much does a regular customer spend over 6 months versus what you're spending to get new ones in the door? When this ratio drops below 3:1, you've got a retention problem, not a marketing problem.
Occupancy cost per transaction tells you if your space works efficiently. Divide total occupancy costs (rent, utilities, insurance) by transaction count. When this creeps above $2 per transaction for most independent cafes, you're either underutilizing your space or paying too much for it.
Menu item profitability ranking is where owners should spend their analytical energy. Not just margin percentages, but actual dollar contribution per item when factoring in prep time, waste rates, and equipment usage.
The experiment runbook that actually gets used
Most cafe owners treat problems like emergencies — something breaks, everyone scrambles, they try five things at once, and nobody knows what actually worked. An experiment runbook changes this chaos into systematic approach that builds institutional knowledge.
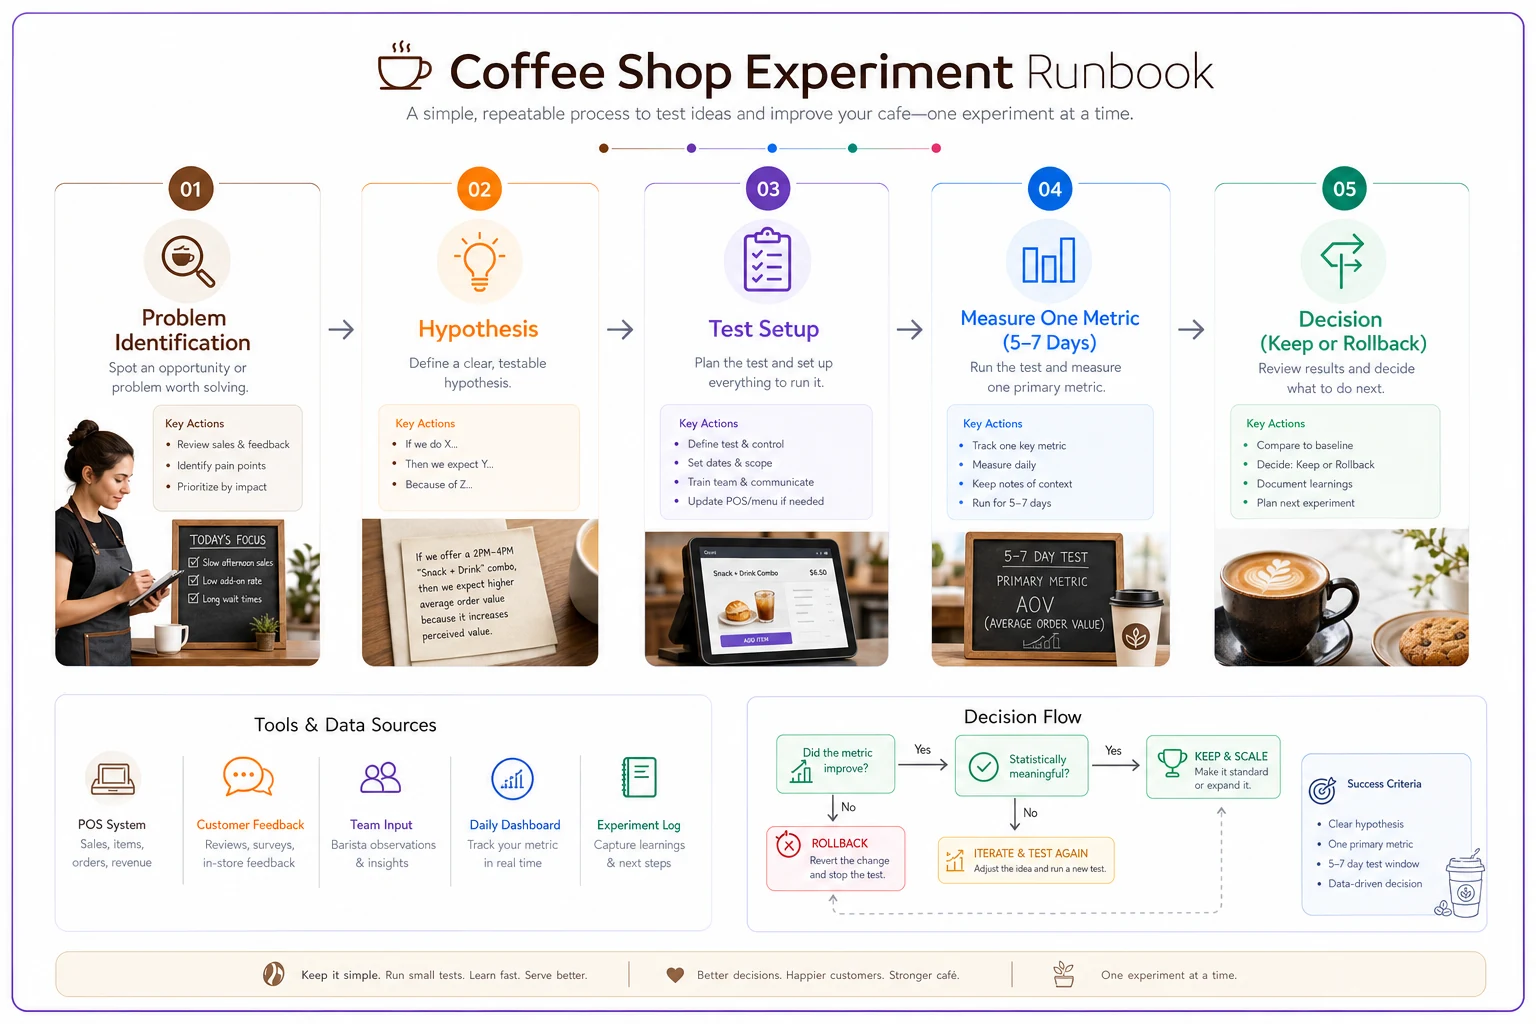
The framework is dead simple: One change, one metric, one week, one decision.
Say your afternoon sales are tanking. Instead of simultaneously changing your menu, running a promotion, adjusting staff, and adding music, you run a controlled test. Week one: extend your breakfast menu to 2pm and track transaction count and average ticket between 12-3pm. Did it move the needle by at least 15%? Keep it. If not, revert and test the next hypothesis.
Actual runbook structure that works: Problem identification: Specific metric outside acceptable range for X consecutive periods Hypothesis: One specific change that could impact that metric Success criteria: Minimum improvement threshold (usually 10-20%) Test duration: Typically 5-7 days for operational changes, 2-3 weeks for menu changes Rollback trigger: If other metrics drop by more than 5% Documentation: What worked, what didn't, why you think so
The key is limiting yourself to 2-3 active experiments at any time. This isn't A/B testing software where you can run 20 simultaneous tests — you're dealing with human behavior and operational complexity.
Limit experiments to 2-3 active tests to avoid overwhelming staff and confusing results.
A bakery-cafe in Denver used this approach when their morning rush efficiency crashed after expanding their menu. Instead of panicking, they tested one fix per week: pre-batching popular drinks, adding a dedicated food runner, then adjusting the menu layout for faster ordering. The third change (menu layout) drove a 22% improvement in order speed. Without disciplined testing, they would've hired more staff and killed their margins.
A quick visual of this runbook can help your team follow the steps.
The third change (menu layout) drove a 22% improvement in order speed. Without disciplined testing, they would've hired more staff and killed their margins.
Sample dashboards that don't require an MBA
Forget fancy visualization software. The dashboards that actually get used in independent cafes are usually just formatted spreadsheets or simple daily scorecards that take 30 seconds to update.
The shift handoff card
Half-sheet of paper that gets filled out during shift change. Not digital, not complex, just five numbers that matter:
-
Transactions this shift
___
-
Remakes/voids
___
-
Waste in dollars
$___
-
Labor hours used
___
-
One thing that broke/ran out
___
Takes literally 45 seconds to complete, creates accountability, builds a paper trail of operational issues.
The manager's daily scorecard
One page, updated each morning, comparing yesterday to the same day last week:
| Metric | Yesterday | Last Week | Change | Action Trigger |
|---|---|---|---|---|
| Total Sales | $1,847 | $2,094 | -11.8% | Under -10%: Review staffing |
| Transaction Count | 287 | 315 | -8.9% | Under -10%: Check wait times |
| Avg Ticket | $6.43 | $6.65 | -3.3% | Under -5%: Review upselling |
| Labor % | 31.2% | 28.7% | +2.5pt | Over 32%: Adjust tomorrow |
| Food Cost % | 29.8% | 27.3% | +2.5pt | Over 30%: Check portions |
The "action trigger" column is what makes this actually useful. No wondering what to do — the decision is pre-made.
The owner's weekly profitability tracker
This focuses on the bigger moves that actually impact whether you're making money:
Week-over-week changes:
-
Sales per labor hour (target
$65-75)
-
Prime cost percentage (target
under 58%)
-
Customer count vs. last 4-week average
-
New vs. returning customer ratio
Month-to-date progress:
-
Days of cash on hand
-
Inventory turnover rate
-
Fixed cost coverage ratio
Notice what's not here? Daily sales totals, weather comparisons, individual employee metrics. The owner dashboard strips away noise and focuses on what drives actual profitability.
Decision rules that prevent analysis paralysis
The death of most metrics programs is the weekly meeting where everyone stares at numbers and nobody makes a decision. Decision rules eliminate this by pre-determining what happens when metrics hit certain thresholds.
Realistic set for a cafe doing $50-60k monthly:
Immediate action triggers (no meeting required):
-
Wait time exceeds 7 minutes for two consecutive hours → Shift lead calls in on-call backup
-
Remake rate exceeds 4% during any shift → Implement double-check protocol for next shift
-
Any product stocks out before 4pm → Double next day's prep quantity
-
Labor runs over 35% on any single day → Manager adjusts next day's schedule
Next-day review triggers (manager handles by 10am):
-
Daily sales under 80% of forecast → Review marketing calendar and weather
-
Food cost exceeds 32% → Spot-check portions and waste logs
-
Customer complaints exceed 2 per shift → Review with specific crew
Weekly strategy triggers (owner reviews):
-
Prime cost exceeds 60% for full week → Menu price evaluation required
-
Transaction count drops 10%+ week-over-week → Review competition and customer feedback
-
Any menu item sells less than 3 per day average → Consider removal
The beauty of decision rules is they remove the emotional component. You're not making panicked decisions during a bad week or getting complacent during good ones. The framework makes the call.
Scaling the framework as you grow
What works for a single cafe with $400k annual revenue looks different at $2M across multiple locations. But the core framework scales — you just add layers without changing the foundation.
Around $1M annual revenue (usually when you hit 12-15 employees), you'll need to add a middle management layer to the metric ownership. Your shift leads start owning daily metrics, managers take weekly ones, and owners move to monthly strategic review.
Experiment velocity also changes. At startup phase, you might run one test per month. By the time you're doing $100k monthly, you should have 2-3 experiments running constantly, with formal review cycles.
The dashboards evolve from paper to simple digital tracking. Not because digital is inherently better, but because you need historical data to spot seasonal patterns. That shift handoff card becomes a Google Form. The daily scorecard becomes a simple automated report pulling from your POS.
What doesn't change is the core principle: every metric needs an owner, every threshold needs an action, every problem needs a test, and every test needs documentation.
Making this work with limited resources
The classic objection from cafe owners is always the same: "This sounds great but I don't have time to build all this." Fair point. You're probably working 60-hour weeks already.
Start with just the shift handoff card. Seriously. Just that one half-sheet of paper, filled out at every shift change. Do that for two weeks and you'll start seeing patterns you never noticed. That afternoon barista who always has high waste? Maybe they need training. Those Tuesday morning voids? Could be a POS issue with loyalty rewards.
Once the shift card becomes routine (usually takes about a month), add the manager's daily scorecard. Keep it manual at first — literally copying numbers from your POS into a spreadsheet each morning. The act of manually entering these numbers forces you to actually look at them.
The experiment runbook can start as a notebook. Write down what you're testing, what happened, what you learned. No fancy frameworks, just basic documentation.
For decision rules, start with just three: one for labor, one for waste, one for customer complaints. Write them on an index card and tape it to your office wall. When those become automatic, add three more.
The AI automation aspect only makes sense once you've got the basic framework running manually. Then you can look at automated dashboard creation that pulls from your POS, inventory, and labor systems. AI-powered forecasting can suggest when to trigger experiments based on metric patterns. Automated alerts can notify the right person when their metric needs attention.
But trying to automate before you have the operational framework is like putting a Ferrari engine in a car with no wheels. You need the structure first, then enhance it with technology.
A real framework implementation
A neighborhood cafe in Austin implemented this framework after struggling with profitability despite steady sales around $65k monthly. They had great coffee, loyal customers, but kept barely breaking even.
Month 1: They started with just the shift handoff cards. Immediately discovered their evening shifts were throwing away $40-60 of product daily — mostly from over-prepping for a rush that never came.
Month 2: Added the manager's daily scorecard. Found their Tuesday-Thursday labor was consistently 5-7% higher than needed based on transaction patterns. Also noticed their average ticket dropped $0.50 on weekends when their experienced baristas weren't working.
Month 3: Implemented the first three decision rules. When waste exceeded $30 per shift, the next shift reduced prep by 20%. When labor exceeded 32%, the manager cut the next day's coverage by one person. When average ticket dropped below $7, they implemented suggested upselling for that shift.
Month 4: Started the experiment runbook. First test: adding a featured pastry pairing suggestion to every coffee order. Result: 18% uptake, $0.43 average ticket increase. Second test: shifting one staff member from barista to dedicated food runner during morning rush. Result: 12% faster service, 8% increase in food sales.
By month 6, they'd increased their profit margin from 3% to 11%, mostly through operational improvements identified by the framework. Same location, same menu, same staff — just better operational governance.
The owner stopped doing crisis management and started doing actual management. The team stopped guessing what mattered and started owning their metrics. The experiments stopped being random and started building systematic improvements.
When frameworks actually drive profitability
The difference between cafes that make money and cafes that just survive isn't usually about coffee quality or location or even customer service. It's about operational discipline. And operational discipline doesn't mean military-style rigidity — it means having clear systems for identifying problems, testing solutions, and scaling what works.
Most independent cafe owners resist frameworks because they feel corporate or restrictive. But the opposite is true. Without a framework, you're constantly reacting, constantly guessing, constantly stressed. With one, you can actually focus on the parts of the business you enjoy — whether that's perfecting your roast profiles, building community, or developing new menu items.
The profitability comes from compound improvements. That 2% reduction in waste, 3% improvement in labor efficiency, 5% increase in average ticket — individually they seem minor. Together, over six months, they're the difference between paying yourself a salary and wondering how you'll make rent.
The framework isn't about perfection. You'll still have bad weeks, difficult customers, equipment failures. But you'll handle them systematically instead of chaotically. You'll know who's responsible for what, what to test, and when to make changes.
Start simple. Pick one metric, assign one owner, create one decision rule. Build from there. In a year, you'll have an operation that runs smoothly enough that you can finally take that vacation without checking sales reports from the beach.
That's what a real cafe profitability framework delivers — not just better numbers, but a business that doesn't depend on the owner working themselves into the ground. The metrics are just the starting point. The framework is what turns those metrics into sustainable profitability.
Ready to brew operational excellence?
Join hundreds of coffee shops using Coffehq to boost efficiency, reduce waste, and elevate customer satisfaction.