


Your margins shrink every quarter, but your sales stay flat or even grow. Sound familiar?
Most independent coffee shop owners treat their menu like a static document — update prices once a year, add seasonal drinks when the big chains do, maybe tweak a description here and there. Meanwhile, ingredient costs shift weekly, customer preferences drift, and what sells well at 7am moves terribly at 2pm.
Coffee shop menu engineering isn't about making things look pretty or copying Starbucks. It's about understanding contribution margin at the SKU level, testing price elasticity without alienating regulars, and knowing when to cut underperformers before they quietly drag everything else down.
The disconnect happens because menu decisions get made in isolation. You price a new drink based on what competitors charge. You keep that specialty latte because one regular orders it every single day. You run the same breakfast sandwich all day because the kitchen already prepped it. Each decision seems reasonable until you realize your best-selling items barely cover costs while high-margin products collect dust on the menu board.
Why traditional menu costing falls apart in coffee shops
Standard restaurant costing works fine for a steakhouse where portions stay consistent and recipes barely change. Coffee shops are a different animal entirely.
Take milk costs. A large oat milk latte uses roughly 12-14 ounces of oat milk — somewhere around $0.28-0.35 per serving depending on your supplier and volume. But that same milk goes into cappuccinos (6oz), cortados (4oz), and as a splash in regular coffee. Your POS shows 47 oat milk drinks sold yesterday. How much milk actually got used? Between testing drinks, resteaming, waste from expired pitchers, and free top-offs, actual usage tends to run 15-25% higher than theoretical.
Recipe drift kills margins faster than rising costs. That caramel macchiato starts at 2 pumps of syrup. Three months later, your senior barista uses 3 pumps because customers said it wasn't sweet enough. New staff train under them. Suddenly your syrup cost jumped 50% with nobody noticing. Multiply that across 15 specialty drinks and you've leaked thousands in margin without a single price change.
Then seasonal complexity hits. Pumpkin spice syrup runs around $18 a bottle, yields maybe 60 drinks, and only sells September through November. Do you price it to recover full cost in three months? Factor in the half-used bottles you'll toss in December? Most shops guess, and most guess wrong.
The traditional 30% food cost target is also largely meaningless when your top seller — black coffee — runs 8% food cost while your Instagram-famous rainbow latte hits 45%. Average them together and the number looks acceptable, but you're still bleeding margin.
Building a contribution-based menu framework
Real menu engineering starts with contribution margin per drink, not food cost percentage. Stop asking "what does this cost?" Start asking "what does this actually contribute?"
Keep every order and shift perfectly aligned.
Coffehq helps you manage orders, inventory, and staff schedules seamlessly.
- Unified order processing
- Real-time inventory updates
- Staff shift coordination
No credit card required
Step 1: True cost per SKU Map every ingredient to every drink. Not the recipe card version — the version your staff actually makes. Include:
-
Primary ingredients at real pour sizes
-
Modifier costs (extra shot, alternative milk, flavor)
-
Disposable costs specific to that drink
-
Prep labor for specialty ingredients
Time a sample of actual pours during rush hours to capture recipe drift.
A honey cinnamon latte might actually look like this:
-
Espresso (2 shots)
$0.31
-
Oat milk (12oz steamed)
$0.34
-
Honey syrup (2oz)
$0.18
-
Cinnamon (dusting)
$0.02
-
Cup/lid (16oz)
$0.19
-
Total
$1.04
Step 2: Velocity-weighted contribution Track actual sales velocity by hour and day. That $4 contribution margin on your breakfast sandwich means nothing if you sell 3 per day. Meanwhile, your $2.20 margin on regular lattes times 85 daily sales drives real profit.
A simple matrix helps here:
| Item | Price | True Cost | Contribution | Daily Units | Daily Contribution |
|---|---|---|---|---|---|
| Latte | $5.50 | $1.20 | $4.30 | 85 | $365.50 |
| Breakfast Sandwich | $8.50 | $4.50 | $4.00 | 12 | $48.00 |
| Honey Cinnamon Latte | $6.75 | $1.04 | $5.71 | 23 | $131.33 |
| Matcha Latte | $7.00 | $2.10 | $4.90 | 8 | $39.20 |
Step 3: Complexity cost Some drinks slow everything down. A layered caramel macchiato done right takes around 90 seconds. During morning rush, those 90 seconds could produce three regular lattes — roughly $8 in lost contribution. That matters.
-
Standard prep time (30 seconds)
no adjustment
-
45-60 seconds
subtract ~$0.50 from contribution
-
60+ seconds
subtract $1-2 from contribution
Step 4: Cross-purchase patterns Track what people buy together. Customers who order $7 specialty drinks usually add a $4 pastry. Cutting that drink might reduce complexity but costs you the pastry sale too. Understand purchase clusters before making cuts.
The A/B pricing experiment framework
Price testing requires structure. You can't raise prices on random items and see what sticks. Your forecast accuracy matters here — test during periods with predictable demand, not during holidays or local events that skew everything.
The staggered rollout method:
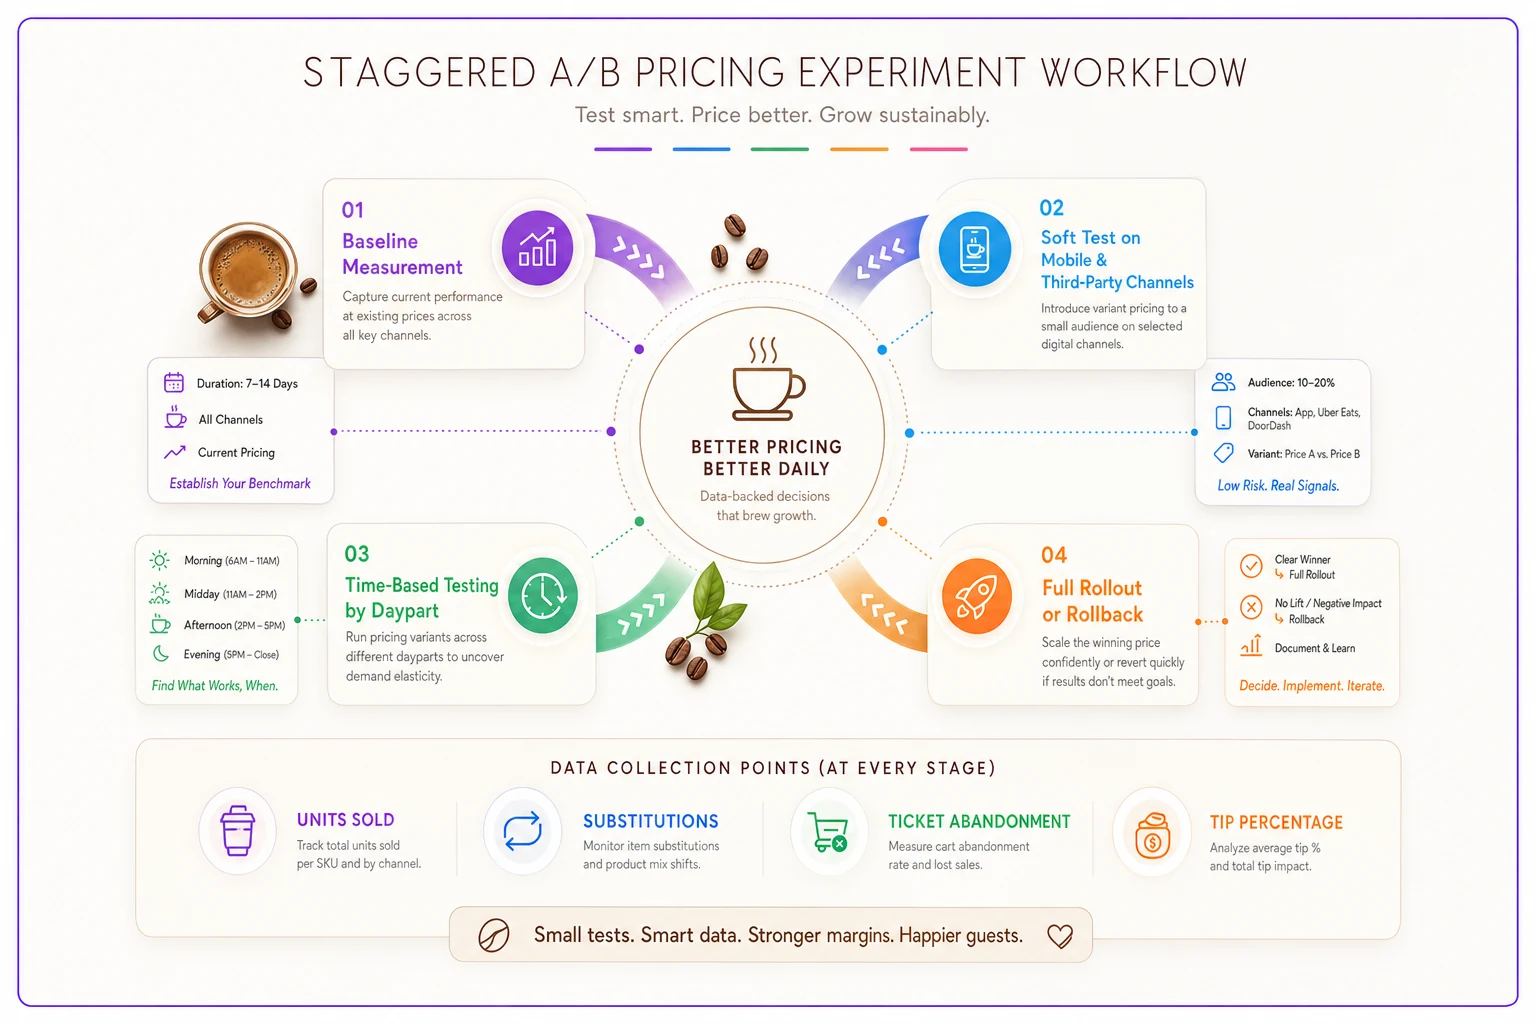
Week 1-2: Baseline measurement Track exact units sold for test items during comparable periods — same days, same weeks. Note weather and local events that might distort results.
Week 3-4: Soft test with non-regulars Adjust prices only on mobile ordering or third-party delivery. Your regulars ordering in-store see original prices. This isolates price sensitivity among less frequent customers first.
Week 5-6: Time-based testing Change prices only during specific dayparts. Afternoons (2pm-5pm) work well — volume is lower and customers are less routine-driven than during morning rush.
Here's a simple workflow for running a staggered A/B pricing test.
-
Ticket abandonment on mobile orders
-
Substitution patterns (did they just buy something else?)
-
Customer complaints or comments about pricing
-
Changes in tip percentage
-
Frequency changes for known regulars
General elasticity guidelines:
-
Core coffee (drip, americano)
Highly inelastic up to 10-15% increases
-
Specialty espresso drinks
Elastic beyond 8-10% increases
-
Seasonal/limited drinks
Inelastic up to a 20-25% premium
-
Food items
Highly elastic beyond 5-7% increases
-
Retail beans
Extremely elastic — you're competing with grocery stores
Week 7-8: Full rollout or rollback Based on what the data shows, either implement across all channels or revert.
Strategic bundling and placement
Bundling in coffee shops isn't just about packaging products. It's about designing routines.
Morning commuter bundles: The coffee + pastry combo is obvious, but execution is what matters. Price the bundle at 85-90% of individual pricing, but only during rush hours (6am-9am). You capture price-sensitive customers without training your regulars to wait for a deal.
One thing most shops get wrong: bundle messaging belongs at the point of order, not the menu board. A barista asking "make it a breakfast combo?" converts at 35-40%. Listing bundles on the menu board? More like 8-12%.
Afternoon energy bundles: 2pm-4pm is dead time for most cafes. A cold brew + energy snack (protein bar, nuts) bundled at $7-8 keeps margin strong because cold brew has almost no labor cost when pre-batched.
The decoy effect in practice: Your menu needs at least one villain — an overpriced item that makes everything else look reasonable. That $12 "Ultimate Mocha" with four add-ins sells maybe 2-3 a day, but it anchors perception. Suddenly your $7 specialty drinks feel like a deal.
Placement matters:
-
List villain items first in each category
-
Use them in promotional photos
-
Have baristas mention them first
"Our Ultimate Mocha is popular, or for something lighter..."
Physical placement that actually drives margin:
-
High-contribution items belong at eye level in your pastry case. Most shops miss the rotation piece — adjust by daypart contribution, not just freshness.
-
Morning (6am-11am)
Breakfast sandwiches and protein boxes at eye level
-
Lunch (11am-2pm)
Sandwiches and salads front and center
-
Afternoon (2pm-close)
Cookies and snack items at eye level, sandwiches lower
Your grab-and-go cooler near the register should mirror this. Staff can make these shifts during natural transition periods without disrupting service.
Seasonal lifecycle and retirement decisions
Every seasonal drink follows a predictable profit curve. Most shops miss the window to act on it.
Week 1-2: Novelty premium New items sell at 150-200% of eventual baseline. Price 10-15% higher at launch — early adopters pay for exclusivity.
Week 3-6: Peak velocity Sales stabilize. This is your data collection period. Track ingredient usage carefully here to understand real margins, not theoretical ones.
Week 7-10: Decline phase Sales drop 20-30% from peak. Decision point: retire, discount, or modify. Most shops hold on too long while contribution quietly evaporates alongside expiring ingredients.
The modification pivot: Instead of killing a declining seasonal item, strip it down to a year-round version. The pumpkin spice latte becomes a cinnamon spice latte. Same base, different syrup, extended lifecycle. Customers who loved the original often adopt the variant without much fuss.
Retirement triggers worth setting in advance:
-
Daily units below 5 for specialty drinks
-
Contribution margin under $2
-
Prep waste exceeding 20% of ingredients
-
Complexity cost exceeding contribution
-
Unique ingredient storage requirements that don't justify the volume
One shop kept a lavender latte on the menu for eight months. It sold 3-4 daily, looked fine at $6.50 with a $4.80 margin. But the lavender syrup required special storage, expired monthly, and added friction during rush. Real contribution after waste and complexity? Negative $0.50 per drink. Eight months of that.
The Monday morning menu audit
Menu problems compound slowly. You need a weekly review that takes 20 minutes but catches profit leaks before they become real damage.
Every Monday before open, pull these numbers:
Velocity check:
-
Bottom 3 selling items from last week
-
Compare to the same week last month
-
Flag anything down 30%+ for review
Margin scan:
-
Any item where ingredient cost changed 10%+
-
New substitution patterns (regular to oat milk shifts)
-
Actual vs theoretical usage gaps over 20%
Complexity review:
-
Average ticket time by item type
-
Items generating remakes or refund requests
-
Drinks requiring special prep or tools
Bundle performance:
-
Bundle attachment rate vs target
-
Which bundles customers build themselves (usually signals an opportunity)
-
Daypart performance of each bundle
This Monday routine catches problems while they're still small. That new barista using double syrup? Caught in week one, not month three. Oat milk price jumped 15%? Adjust pricing or portions now, not at year-end review.
Making menu engineering systematic with operational software
Manual menu analysis breaks down fast as complexity grows. Tracking contribution margins across 40+ SKUs with modifiers, monitoring price test results, managing seasonal transitions — it becomes a full-time job that nobody actually does full-time.
Modern operational software handles the math while you handle the decisions. AI-powered platforms can track real-time contribution margins by pulling costs from your suppliers and matching them against POS data automatically. When integrated with your purchasing systems, the software knows when ingredient costs shift and flags items that need price adjustments before you even notice.
The A/B testing side removes guesswork too. Instead of manually tracking test periods and grinding through elasticity calculations, AI automation identifies optimal test windows from your historical patterns, segments customers, and gives you statistical confidence levels for each price change. Clear recommendations like "raise iced coffee $0.25 — 95% confidence of maintaining volume" are a lot easier to act on than gut instinct.
For seasonal planning, platforms that analyze past performance can predict demand curves and recommend retirement dates before items become margin drags. Ingredient expiration tracked alongside sales velocity means fewer surprises in December when you realize you have six bottles of pumpkin syrup left.
The most useful automation happens in daily operations. Rather than waiting for Monday audits, the platform monitors menu performance continuously and flags items drifting outside acceptable ranges — recipe compliance, portion creep, complexity bottlenecks. Specific alerts, specific recommended actions.
The discipline that separates profitable cafes from the rest
Menu engineering isn't a project you finish. It's an operational habit that profitable cafes maintain consistently. The shops pulling 15-18% EBITDA margins while others scrape along at 5-8% aren't just lucky with location. They treat their menu as a system that needs constant calibration, not a document that gets updated once a year.
Your menu drives nearly everything else — labor needs, inventory requirements, equipment investments, even which customers you attract. Yet most independent cafes spend more energy choosing cup suppliers than analyzing menu performance.
Start with contribution margin visibility. If you can't tell me the exact contribution of your top 10 items right now, that's the first thing to fix. Build the framework, even in a basic spreadsheet. Add velocity weighting next. Then complexity costs.
Test prices systematically, not emotionally. That one regular who complains about a $0.25 increase was probably going to find something to complain about anyway. The 80 other customers who didn't notice just quietly improved your margins by $20 a day.
And develop the discipline to actually cut underperformers. Every item you keep despite negative contribution is a choice — you're subsidizing poor performance with revenue from things that actually work.
The cafes that hold up over the next few years won't necessarily have the most creative drinks or the nicest interiors. They'll be the ones that treat coffee shop menu engineering as a core operational competency — measured, tested, and adjusted continuously. The math isn't complicated. The discipline is just rare.
Ready to brew operational excellence?
Join hundreds of coffee shops using Coffehq to boost efficiency, reduce waste, and elevate customer satisfaction.