
The worst coffee shop financial model I ever built had 47 tabs, color-coded cells everywhere, and took about three weeks to finish. It looked great during investor meetings. But when the owner needed to know if adding a third morning barista would pay for itself, the model was completely useless. All those projections couldn't answer a basic operational question.
That was six years ago. Since then I've built financial models for roughly 80 coffee shops. The ones that actually get used are brutally simple spreadsheets that connect operational decisions directly to profit impact. No fancy macros, no complex formulas—just clear connections between what happens on the floor and what shows up on the P&L.
Why traditional cafe financial models break
Most coffee shop owners inherit their financial model from somewhere. Maybe they downloaded a template, copied a friend's spreadsheet, or got one from their accountant. These models track the right categories—revenue, COGS, labor, rent—but they're disconnected from daily operations.
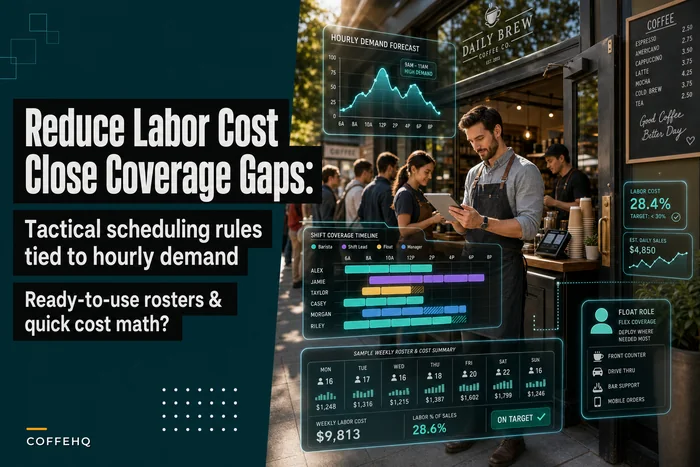
You get monthly P&L statements showing labor at 32% of revenue. Fine. But that number doesn't tell you whether your Tuesday afternoon shift is overstaffed or if your Saturday morning rush needs another person. Financial data lives in one world, operational decisions happen in another, and there's no bridge between them.
A cafe in Portland had beautiful financial reports—professional accounting software, monthly reviews with their CPA, all the standard metrics tracked. Yet profit kept dropping despite steady revenue. Turned out their afternoon shifts were running with three people when transaction data showed they only needed two. That extra person, five days a week, four hours per shift, was running close to $7,800 a month straight off the bottom line. Their financial model never caught it because it wasn't built to connect staffing decisions to hourly demand patterns.
Traditional models work backwards from totals. They take your monthly labor cost, divide by revenue, and give you a percentage. But operational decisions happen forwards from specific moments—how many people do I need at 10am on Tuesday? What's my break-even if I stay open an extra hour? Should I add another machine or hire another barista?
Building the foundation: hourly demand drives everything
Your coffee shop financial model needs to start where your business actually happens: hour by hour, transaction by transaction. Not monthly rollups or weekly averages, but the actual pattern of when customers walk through your door.
Keep every order and shift perfectly aligned.
Coffehq helps you manage orders, inventory, and staff schedules seamlessly.
- Unified order processing
- Real-time inventory updates
- Staff shift coordination
No credit card required
What most operators miss is that demand isn't just about total transactions. It's about transaction complexity during each hour. A morning rush of 60 complicated drinks requires different staffing than 60 simple drip coffees in the afternoon. Your model needs to capture both volume and complexity.
Start with a simple hourly grid. Seven days across, hours of operation down. For each cell, track:
-
Transaction count
-
Average ticket
-
Drink complexity (simple/medium/complex)
-
Food attachment rate
This becomes your demand map. Everything else in the model references back to these cells. When you're considering staying open later, you're not guessing—you're looking at actual patterns and their profit implications.
The complexity piece matters more than most people realize. I've seen cafes where morning drinks average 4.5 steps while afternoon drinks average 2.5 steps. Same transaction count, completely different labor needs. Miss this in your model and you'll either overstaff afternoons or understaff mornings.
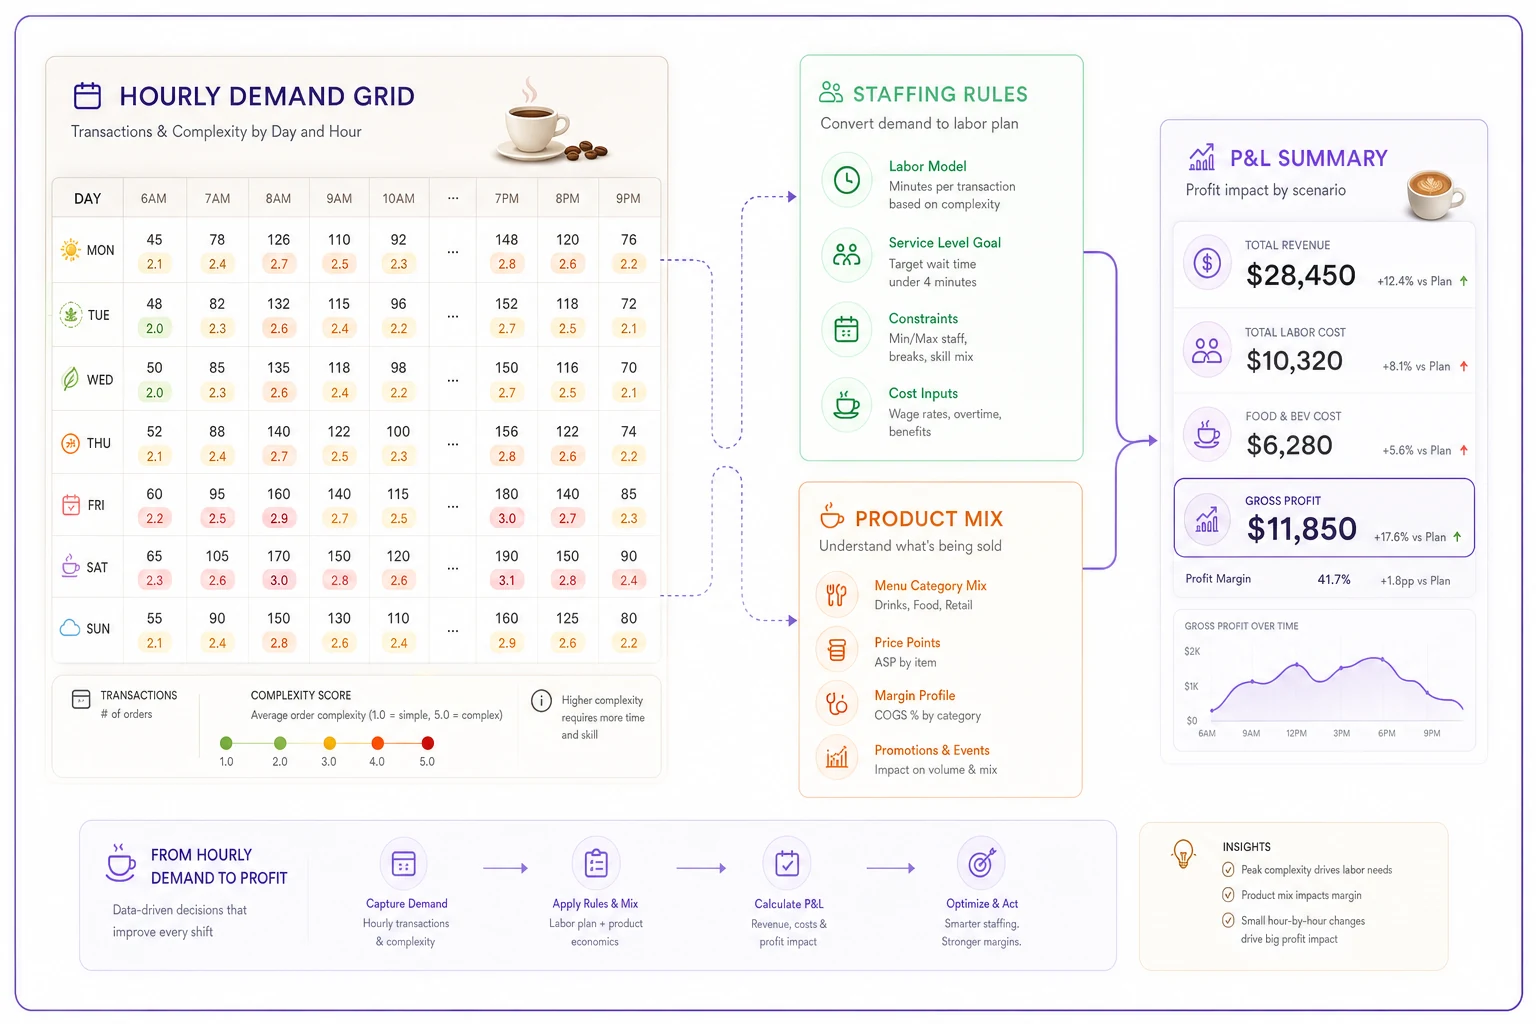
Here's a quick visual of how hourly demand should flow into staffing and P&L.
Labor rules that reflect reality
Once you have hourly demand mapped, you can build staffing rules that match your actual operation. Not generic ratios like "one barista per 30 customers," but specific rules for your cafe.
The key is understanding your break points. At what transaction volume do you absolutely need a second person on bar? When does the register back up without a dedicated cashier? What's the maximum drinks per hour one barista can handle while maintaining quality?
-
Under 20 transactions/hour
1 person total
-
20-35 transactions/hour
2 people (1 bar, 1 register/support)
-
35-50 transactions/hour
3 people (2 bar, 1 register)
-
Over 50
Add 1 person per additional 20 transactions
Your numbers will differ, but the structure stays the same. The model now automatically calculates staffing needs based on demand patterns, not fixed schedules. Change your hourly projections and labor costs adjust immediately.
Add skill level modifiers and it gets more interesting. An experienced barista might handle 25 drinks per hour while someone newer maxes out at 15. Your model can account for this by adjusting break points based on who's scheduled. This is how you start seeing the real cost of turnover or the actual value of training investment.
Product-level COGS that scale with mix
Most coffee shop financial models treat COGS as a flat percentage—usually somewhere between 25-35% of revenue. But a cortado and a bagel sandwich have vastly different margins. Your model needs to reflect what you're actually selling, not category averages.
Build a simple product table:
-
Item name
-
Selling price
-
Direct cost (ingredients only)
-
Prep time
-
Complexity score
Then track your product mix percentages. If lattes are 35% of transactions, cortados 15%, drip coffee 20%, and so on. Your model multiplies these percentages by hourly transactions to estimate product-specific COGS.
This granularity matters for scenario planning. Adding a new food menu? Model the exact items, their costs, and expected mix. The P&L impact becomes clear immediately. Considering a price increase on specific drinks? See exactly how it flows through based on current purchase patterns.
The complexity score also feeds back into your labor model. A menu shift toward simpler drinks might let you reduce staffing even at the same transaction count. A shop in Seattle cut their afternoon labor by around 20% just by promoting batch brew over pour-overs during slow periods. Their model had shown the move would save roughly $2,400 monthly with minimal revenue impact—and it did.
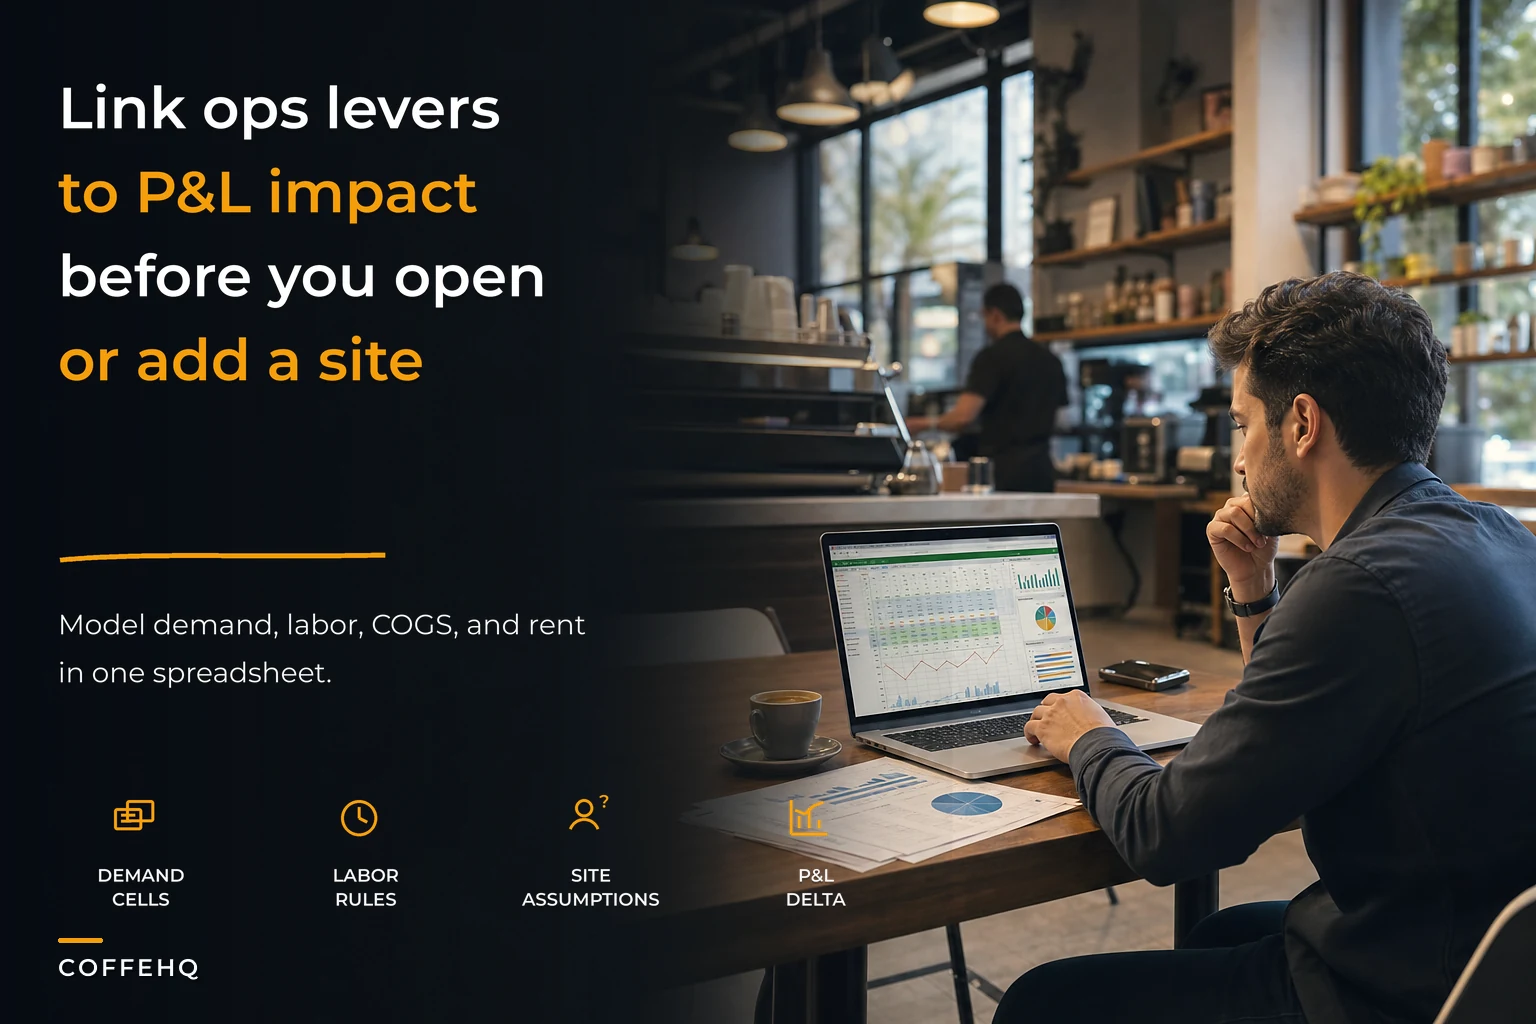
Rent and fixed costs: the scenario pressure test
Rent feels like a simple line item until you're comparing locations or negotiating renewals. Your model needs to break down occupancy costs in ways that support actual decisions.
Instead of just tracking total rent, calculate:
-
Rent per square foot
-
Rent per seat
-
Rent per peak hour transaction
-
Break-even transactions per day
These metrics let you pressure test scenarios. Considering a smaller location with lower rent? The model shows whether reduced seating capacity will hurt revenue more than the rent savings help. Looking at a prime location with double the rent? Calculate exactly how many additional transactions you need to break even.
Layer in the semi-fixed costs that vary by location:
-
Utilities (varies by square footage and equipment)
-
Insurance (location and size dependent)
-
Maintenance (age and condition of space)
For multi-site scenarios, create location templates—urban storefront, suburban strip mall, kiosk—each with different cost structures and capacity constraints. Now you can model expansion scenarios with realistic numbers instead of optimistic guesses.
Single-site changes and their ripple effects
This is where your coffee shop financial model becomes genuinely useful—showing how small operational changes cascade through the P&L.
Say you're considering extending hours on Friday and Saturday nights, staying open until 9pm instead of 7pm. Basic analysis might look at average hourly revenue and costs. But your operational model shows: Demand projection: 15-20 transactions per hour based on foot traffic patterns Labor need: 2 people (1 barista, 1 closer/cleaner) Product mix shift: Higher percentage of decaf and pastries Incremental costs: Around $280 weekly in labor, $40 in utilities Revenue potential: $420-560 weekly
But basic analysis misses the ripple effects. Evening customers tend to have lower ticket averages. Milk waste increases because evening demand is harder to predict. The morning opener arrives to equipment that's been sitting longer, requiring extra cleaning. A well-built model captures these connections.
Working through this exact scenario with a shop in Austin, the model showed extended hours looked profitable on paper—around $500 weekly margin. But once we added hidden costs (waste, cleaning supplies, equipment wear) and factored in lower evening margins, actual profit was closer to $180 weekly. Still worth doing, but nowhere near the windfall they expected.
The real power comes from testing multiple changes simultaneously. Add evening hours and introduce a happy hour discount. Reduce morning staffing but add an afternoon baker. Switch to more efficient scheduling patterns while adjusting product mix. The model shows combined impact, not just isolated changes.
Multi-site expansion: when the model really proves its value
Opening a second location is where bad financial models destroy coffee shops. You take your current numbers, multiply by two, assume 70% of revenue with 60% of costs, and six months later you're bleeding cash and can't figure out why.
Real multi-site modeling requires understanding operational dependencies. Some costs genuinely share (management, marketing, accounting), others duplicate completely (rent, front-line labor), and many fall somewhere between.
Build your model with allocation rules:
-
Manager salary
60% location 1, 40% location 2
-
Marketing
Split by revenue percentage
-
Supply ordering
10% volume discount applied
-
Training costs
Front-loaded at new location
The critical thing to understand—operational complexity doesn't scale linearly. Running two cafes isn't twice as hard as running one; realistically it's somewhere around 2.5-3x as demanding. Your model needs to reflect this through realistic assumptions about management time, coordination costs, and efficiency losses.
Create what I call "circuit breaker" metrics. These are thresholds that trigger model warnings:
-
Single manager covering more than 80 total staff hours weekly
-
Drive time between locations exceeding 20 minutes
-
Shared staff percentage over 30%
-
Combined locations requiring more than 150% of current storage
When any circuit breaker trips, the model flags that you need additional infrastructure—another manager, separate supply chains, dedicated storage. This prevents the optimistic modeling that kills expansion plans.
Sensitivity rules: finding your operational leverage points
Every coffee shop has different leverage points—operational changes that disproportionately impact profit. Your model needs sensitivity analysis to find yours.
Build a simple sensitivity table. Down the left: operational variables (price, transactions, labor hours, COGS). Across the top: percentage changes (-10%, -5%, +5%, +10%). Each cell shows the profit impact.
| Operational variable | -10% | -5% | +5% | +10% |
|---|---|---|---|---|
| price | ||||
| transactions | ||||
| labor hours | ||||
| COGS |
What you find often surprises owners. A boutique coffee shop in Denver spent months trying to negotiate rent down by $500. Their sensitivity analysis showed that reducing average transaction time by 30 seconds would generate over $2,000 monthly in additional capacity during peak hours. Same effort, dramatically more impact.
Common high-leverage points in cafes:
-
Morning peak throughput
-
Milk waste percentage
-
Average ticket size
-
Staff scheduling efficiency
But every shop is different. A high-rent downtown location might find that extending peak capacity is the biggest lever. A suburban shop might discover that food attachment rate drives everything. The model reveals your specific leverage points.
Don't just run sensitivity on single variables either. Test combinations—what if prices increase 5% and transactions drop 3%? What if you improve throughput 15% but labor costs increase 8%? These compound scenarios reflect real operational trade-offs much better than isolated projections.
The spreadsheet architecture that actually works
Structure matters as much as formulas. A brilliant model nobody can understand is worthless.
Organize your spreadsheet into clear sections:
-
Inputs tab
Everything adjustable goes here. Hourly demand, product prices, labor rates, rent. No formulas, just values. This is where operators make changes.
-
Rules tab
Your operational logic. Staffing break points, COGS calculations, allocation percentages. These are formulas that reference the Inputs tab.
-
Calculations tab
The engine. Pulls from Inputs and Rules to calculate hourly labor needs, daily COGS, weekly overhead allocation. This gets messy—that's fine, operators never see it.
-
Scenarios tab
Pre-built combinations. "Add evening hours," "Launch food menu," "Open location 2." Each scenario adjusts multiple inputs simultaneously.
-
Dashboard tab
What operators actually look at. Key metrics, simple charts, scenario comparison. Everything on one screen.
Color coding that makes sense:
-
Blue cells
Change these
-
Gray cells
Calculated, don't touch
-
Green cells
Positive variance from plan
-
Red cells
Negative variance from plan
Keep formulas simple enough to audit. If you can't explain a calculation in one sentence, it's too complex. The goal is a model operators can modify without breaking—not a masterpiece of spreadsheet engineering.
Common modeling mistakes that kill accuracy
Using industry averages instead of your data. Industry COGS might be 30%, but if yours is 34% because you source premium ingredients, your model needs to reflect that reality. Modeling yourself into bankruptcy by assuming you'll hit benchmarks you've never achieved is more common than it should be.
Modeling perfection instead of reality. Staff won't hit optimal efficiency every hour. Equipment breaks. People call in sick. Build in reality buffers—around 85% efficiency is more accurate than 100%.
Ignoring step changes. Costs don't always scale smoothly. Adding one more transaction might require a whole additional staff member. Growing from 80 to 81 seats might trigger different insurance requirements. Model the jumps, not just the slopes.
Missing hidden connections. A new lunch menu doesn't just add revenue—it changes morning prep requirements, increases storage needs, and complicates inventory. Your model needs to capture these operational connections, not just the obvious financial ones.
Over-optimizing the model. Spending weeks perfecting a spreadsheet while your actual operation suffers is a real trap. The model should take maybe 20 hours to build initially, then evolve with your business. Perfect is the enemy of useful.
Turning model insights into operational improvements
A financial model is worthless if it doesn't drive better decisions.
Run weekly scenario reviews. Every Monday, test one operational change in the model—not massive overhauls, just small tweaks like adjusting Tuesday afternoon staffing or changing a supplier. See the projected impact, implement the promising ones, track actual results.
Share simplified versions with managers.
Create decision triggers. When hourly transactions consistently exceed your staffing break points, that's a hiring trigger. When product mix shifts significantly from modeled assumptions, update your COGS calculations. The model tells you when to act, not just what's happening.
Share simplified versions with managers. They don't need the full model, but showing them how their decisions impact profit changes behavior. A shift supervisor who understands that over-scheduling by one person costs $60 in profit makes better calls.
Track variance weekly. Compare actual results to what the model predicted. Large variances mean either your assumptions are wrong or something operational has changed—both are valuable signals.
The best coffee shop financial model I've built fits on five spreadsheet tabs and gets updated every week. The owner can test any operational change in under two minutes and see its profit impact immediately. That's the standard worth aiming for—simple enough to actually use, sophisticated enough to be accurate, and connected enough to drive real operational improvements.
Building this kind of model takes focus and some discipline upfront. But once you have it, you stop making decisions based on gut feeling and start making them based on operational reality. In the coffee shop business, where margins are thin and competition is everywhere, that edge makes a real difference.
Start with the basics—hourly demand patterns and staffing rules. Add complexity as you need it. But always keep the connection between operations and financial outcomes clear. That's how you build a financial model that actually drives better decisions, not just better-looking reports.
Ready to brew operational excellence?
Join hundreds of coffee shops using Coffehq to boost efficiency, reduce waste, and elevate customer satisfaction.