



Your Square POS says you sold 147 oat milk lattes yesterday. Your inventory system shows you used enough oat milk for 189. Your scheduler had three people on the floor during a $400 revenue hour. And your QuickBooks? It's showing yesterday's deposit as $2,847 when Square says it should be $2,913.
That's the data sync nightmare quietly bleeding cafes dry. Not the dramatic, obvious kind of loss—the slow, persistent leak that compounds into thousands of missing dollars each quarter.
Most cafe owners discover these gaps during tax season or when cash gets tight. By then, you're looking at months of compounded errors, missing deposits, and inventory discrepancies that nobody can explain.
And the worst part is you can't even pinpoint where it started.
The four-headed monster of cafe data
Running a coffee shop means juggling four separate data streams that rarely align:
Your POS tracks sales but doesn't know what ingredients actually left your shelves. It records that medium caramel macchiato, but has no idea if your barista used 4oz or 6oz of milk, grabbed oat instead of whole, or accidentally rang it up as a latte.
Your inventory system counts products but relies on manual counts and theoretical usage. That case of vanilla syrup might show "8 bottles remaining" in your spreadsheet, but two are already opened at different stations, one's been misplaced in dry storage, and nobody logged the bottle that broke last Tuesday.
Your scheduling platform manages labor but operates in isolation from actual sales patterns. You're scheduling based on gut feel or last month's averages while your POS holds the real story of when customers actually show up and how much they spend.
Your accounting software processes money but depends on imports, uploads, and manual entries from everywhere else. Every integration failure, every delayed sync, every manual workaround creates another opportunity for numbers to drift.
These systems generate roughly 2,000 data points daily in an average 40-transaction-per-hour cafe. Miss just 1% of those connections and you're looking at 20 errors per day—around 600 monthly discrepancies slowly corrupting your picture of the business.
Where sync failures hide in plain sight
The dangerous sync failures aren't the obvious ones. When Square goes down completely, you notice. When QuickBooks won't import, you investigate. The profit killers are the partial failures, the silent mismatches, the "close enough" syncs nobody catches.
Keep every order and shift perfectly aligned.
Coffehq helps you manage orders, inventory, and staff schedules seamlessly.
- Unified order processing
- Real-time inventory updates
- Staff shift coordination
No credit card required
Take modifier tracking. Your POS might record "iced latte + oat milk" as a $6.50 sale. But if your inventory system doesn't properly map that oat milk modifier, it defaults to regular milk in the depletion calc. Multiply that across 30 oat milk drinks daily and you're showing phantom dairy inventory while your oat milk disappears without explanation. Over a month, that's roughly 900 transactions where your theoretical vs actual inventory drifts further apart.
Or consider tip distribution. Your POS records $340 in credit card tips for Tuesday. The batch settles Wednesday morning. Tips get distributed Thursday. By the time those tips hit your accounting system, they might be tagged to the wrong day, the wrong shift, or bundled with another day's tips entirely. Your labor cost percentage becomes meaningless when the numerator and denominator come from different time periods.
Refunds create another silent leak. A customer disputes a charge three weeks later. Your payment processor issues the refund. But that refund might never make it back to your POS reports, never adjust your inventory depletion, never update your sales tax calculation. You're paying tax on revenue you didn't keep.
Even something as basic as clock-in times creates cascading problems. Employee clocks in through your scheduling app at 6:47 AM. Your POS shows their first transaction at 7:02 AM. Payroll system rounds to 7:00 AM. Three systems, three different labor cost calculations, no single source of truth.
Building your reconciliation framework
Real POS inventory reconciliation for cafes isn't about perfect accuracy—it's about catching problems before they compound. You need a system that flags issues while they're still investigable, not three months later during an inventory count.
Start with daily touch points. Not full reconciliation, just quick sanity checks that take under five minutes:
| Touch point | Description |
|---|---|
| Morning sync verification | Before you open, check yesterday's closing numbers. Does your POS day-end report match what hit your bank? Not to the penny, but within expected variance for processing delays. If Square says $2,847 but only $2,200 deposited, you investigate today, not next week. |
| Midday inventory pulse | Pick three high-velocity items—probably milk, your main coffee blend, and cup lids. Do a quick physical check against what your system thinks you have. If the gap is over 10%, something's broken in your tracking. |
| End-of-shift labor check | Compare scheduled vs actual hours right after each shift ends. Did Sarah leave two hours early? Did Marcus stay an extra hour for that unexpected rush? Catch these while everyone still remembers why. |
Weekly reconciliation goes deeper. This is where you catch the slow leaks.
Map every deposit to its originating sales. That $8,742 that hit your account Tuesday should trace back to specific days and shifts. Build a simple spreadsheet: Date, POS Total, Expected Deposit, Actual Deposit, Variance, Notes. Patterns emerge quickly—maybe Monday deposits are consistently short because of weekend processing delays, or afternoon shifts show higher variance because of split tender complications.
For inventory, focus on conversion accuracy, not just raw counts. If you sold 312 lattes this week, that should translate to predictable milk usage. Build simple ratios: one gallon should yield roughly 25–30 medium lattes depending on waste and pour style. When you're getting 35+ drinks per gallon or under 20, either your recipes are drifting or your recording is broken.
Labor reconciliation reveals the expensive gaps. Pull three numbers weekly: scheduled hours, clocked hours, and productive hours (when sales exceeded $X per labor hour). The gaps tell stories. Scheduled 180 hours but clocked 195? You're bleeding through early clock-ins or forgotten clock-outs. Clocked 195 but only 160 were productive? Your scheduling doesn't match your traffic.
Here's a quick visual of the daily-to-weekly reconciliation workflow.
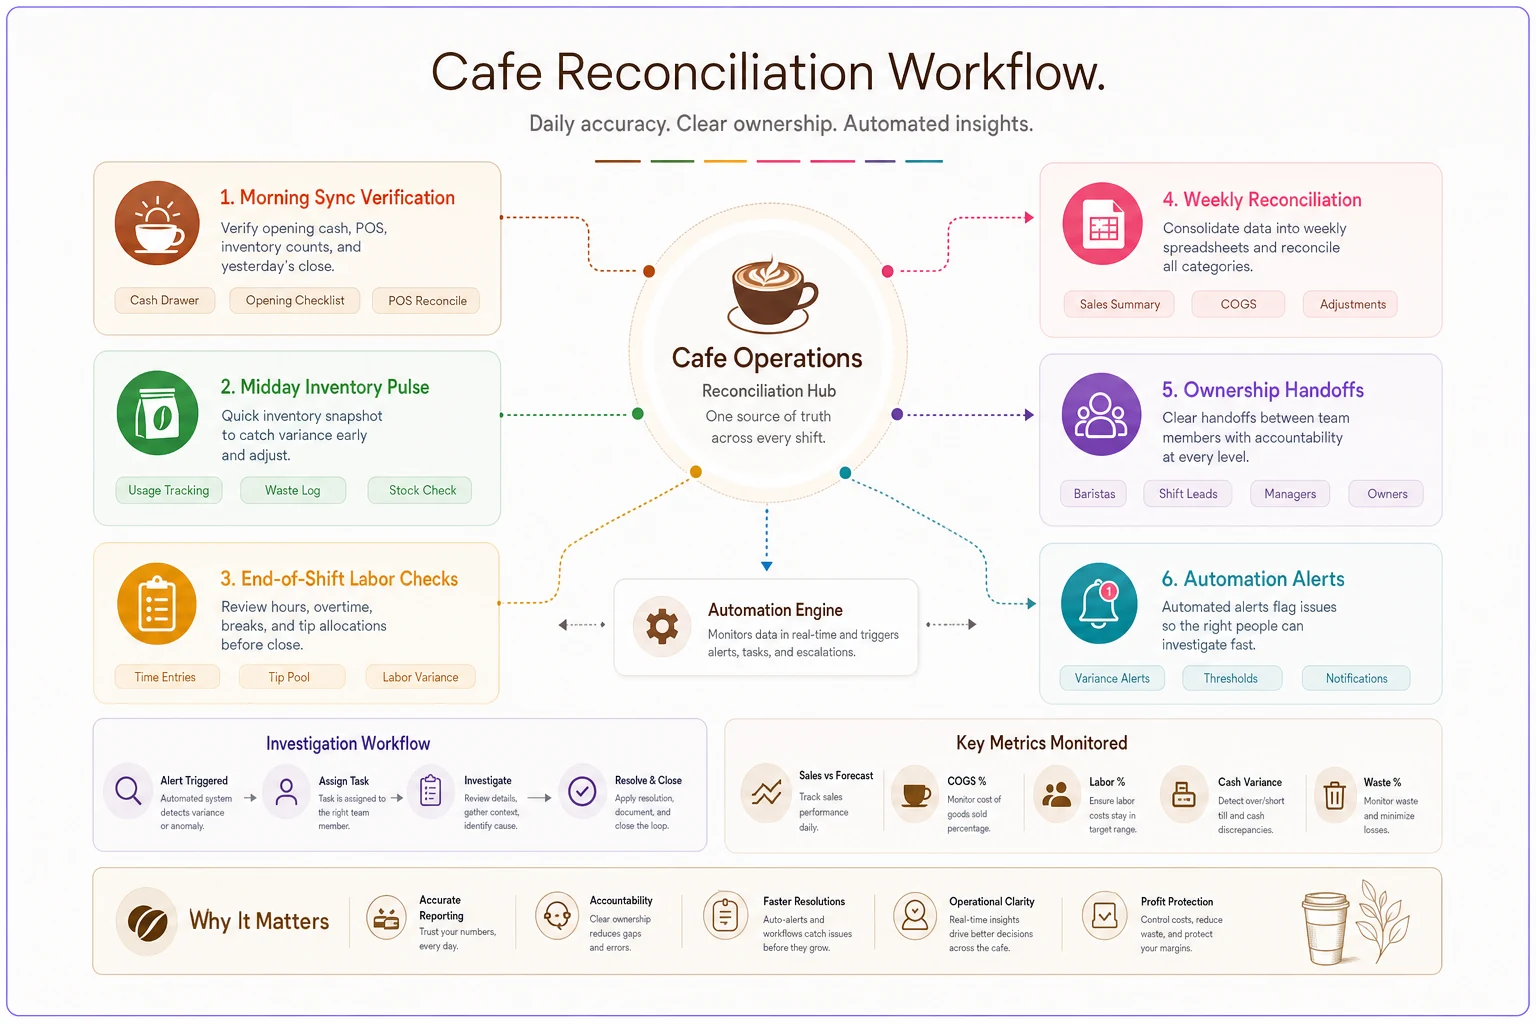
Real reconciliation ties small daily checks into weekly pattern analysis so small mismatches get investigated before they become big problems.
The ownership matrix that actually works
Data reconciliation fails when everybody assumes somebody else is handling it. Your barista assumes the shift lead checks inventory. Shift lead assumes the manager reconciles the POS. Manager assumes the owner handles QuickBooks. Owner assumes the accountant catches everything.
Baristas own transaction accuracy. They're responsible for proper ring-ups, modifier selection, and void documentation. But they need a simple way to flag issues. Create a "sync problem log" right next to the POS. Weird decline? Log it. Refund confusion? Log it. System glitch? Log it. Takes five seconds, saves hours of investigation later.
Shift leads own daily balancing. They count the till, run the Z-report, and document any variance over $5. More importantly, they own the narrative. Why was the morning short $23? They know about the customer who claimed their card was charged twice, the trainee who struggled with split payments, the 20-minute POS freeze during morning rush.
The manager owns weekly patterns. They're looking at trends, not transactions. Why do Tuesday deposits consistently run short? Why does oat milk disappear faster than sales suggest? They maintain the master reconciliation spreadsheet and flag issues for investigation.
The owner owns system relationships. When POS doesn't match deposits, when inventory doesn't match sales, when labor doesn't match revenue—the owner decides if it's a training issue, a system issue, or a vendor issue. They also own vendor relationships when sync problems need escalation.
This isn't about hierarchy. It's about proximity to information. The person closest to the data point should own its accuracy. The person with the broadest view should own pattern recognition.
Automated checks that catch 80% of problems
Manual reconciliation catches problems, but automated checks prevent them. The trick is setting up simple validations that run continuously—not complex systems that break constantly.
Start with transaction velocity monitoring. Your POS processes roughly 25–45 transactions per hour during peak times. Set a simple alert: if any hour shows zero transactions between 7 AM and 7 PM, something's wrong. Either your internet died, your POS crashed, or someone forgot to switch from training mode. This catches dead zones in your data before they become reconciliation nightmares.
Build ratio triggers for inventory. If your coffee-to-milk usage ratio suddenly shifts by more than 20%, investigate immediately. Maybe someone changed the recipe, maybe milk is being wasted, maybe sales aren't recording properly. The specific cause matters less than catching the drift quickly.
Start with conservative thresholds to avoid alert fatigue.
Create deposit variance alerts. Your processor probably offers webhook notifications for deposits. Compare them automatically against POS daily totals. When variance exceeds 2% or $50—whichever is smaller—trigger an email. This catches batch settlement issues, tip distribution problems, and refund gaps while the trail is still warm.
Labor efficiency triggers work well when kept simple. If any shift shows less than $60 in sales per labor hour, send an alert. Not because $60 is a magic number, but because it forces someone to explain why Tuesday afternoon needed four people for $180 in revenue.
The key to automation is restraint. Too many alerts and people ignore them all. Start with these four, tune the thresholds to your operation, add more only when you've mastered these basics.
Your triage playbook for common failures
When sync fails—and it will—you need a clear escalation path.
The deposit mismatch First, check processing delays. Different payment types settle at different speeds. Next, look for batch splits—large days sometimes get processed in multiple deposits. Then investigate refunds and chargebacks that might not show in POS reports. Finally, check for manual adjustments made directly in the processor portal. Document everything in your variance log, even when you find the answer.
The inventory drift Start with recipe consistency. Are baristas following portions? Check waste logging next—broken bottles, expired products, spills during rush. Then look at receiving accuracy. Did that milk delivery actually contain 15 gallons or was it 12? Look at modifier mapping last. The purchase-to-stock playbook walks through this in detail, but the quick version: trace five specific products from purchase through sale for one complete day.
The labor paradox When scheduled hours don't match clocked hours don't match paid hours, start at the source. Pull raw clock data from whatever system physically records punches. Compare against scheduled shifts to find the variation points. Check for manual edits in your payroll system. Then investigate policy gaps—are people clocking in from their phones before arriving? Are managers adjusting times without documentation?
The sales tax mystery Tax calculation errors compound invisibly until audit time. When daily tax collected doesn't match what your accounting shows, first verify tax rates in both systems. Check if certain products are incorrectly flagged as tax-exempt. Investigate split transactions where tax might be calculated on parts rather than the whole. Document any manual overrides or corrections.
Each failure pattern needs a specific owner and a resolution timeline. Deposit issues get same-day investigation. Inventory gaps get weekly review. Labor paradoxes get addressed before payroll runs. Tax issues get monthly deep-dives.
Scale breaks everything (here's how to prepare)
That reconciliation system working perfectly for your single location? It tends to fall apart somewhere around $2 million in revenue or when you add a second site. Not because the math gets harder, but because the human elements multiply.
At one location, your manager knows every transaction anomaly. They remember the customer who complained, the afternoon the internet went down, the new barista who kept voiding orders. Add a second location and suddenly you're reconciling across different POS terminals, different bank deposits, different inventory delivery schedules. Your quick morning check becomes an hour-long investigation across multiple dashboards.
The breaking points are fairly predictable:
Around 80 transactions per hour, manual till counting becomes a bottleneck. Shift leads spend more time reconciling than supporting the team. This is when integrated cash management systems actually pay for themselves.
At roughly $5,000 in daily revenue, Excel-based tracking hits its limit. Not because Excel can't handle the data, but because the manual entry burden creates more errors than it catches. You need actual database-driven reconciliation.
When you hit 15+ employees, the shift hand-off becomes a data integrity problem. Morning shift says they left 8 gallons of milk. Afternoon shift says they received 6. Nobody logged the catering order that consumed the difference.
The solution isn't more complex systems—it's better handoff protocols. A simple shift transfer checklist works: till count, inventory quick-check of five key items, equipment status, and a few notes on anything weird that happened. Takes three minutes, prevents hours of investigation.
Making peace with imperfect data
Perfect POS inventory reconciliation in a cafe is a fantasy. You're dealing with perishable products, human operators, and systems originally designed for different industries then duct-taped together. The goal isn't perfection—it's catching the big leaks before they become floods.
Set variance thresholds that match reality. If your daily deposits are within 1.5% of POS totals, you're doing better than most. If inventory variance stays under 3% for dry goods and 5% for perishables, you're operating at industry-leading levels. Labor clock variance under 2% is essentially as good as it gets given rounding and break time variations.
What matters is consistency. A steady 2% variance you understand beats random swings between perfect matching and 8% gaps. Linking operational levers to your P&L helps quantify which variances actually impact profitability versus which ones are just noise.
Document your acceptable variance ranges. Train your team on when to escalate versus when to simply note the variance. Build monthly trend reports that show variance patterns over time, not just daily discrepancies.
The compound effect of small fixes
A boutique cafe in Denver was losing roughly $3,400 monthly through sync failures they didn't know existed. Their POS showed strong sales. Their bank showed regular deposits. But the gaps between systems were eating about 4% of gross revenue.
The first problem was tip distribution timing. Credit card tips were being batched and deposited 2–3 days after the actual sales. Their daily reconciliation compared Monday's sales with Monday's deposits, missing the lag entirely. They shifted to comparing sales dates with expected deposit dates based on their processor's actual schedule. Found $800 in "missing" deposits immediately.
The second leak was modifier mapping. Their inventory system didn't recognize POS modifiers for alternative milks. Every oat, almond, and soy substitution depleted regular milk in the theoretical inventory. They spent one afternoon mapping every modifier to its actual inventory item. Variance dropped from 8% to 3% immediately.
The third gap was labor overlap. Employees clocked in when they arrived but didn't clock out until after they'd finished cleaning and closing—sometimes 20–30 minutes after the last sale. Actual productive labor was about 12% lower than reported. They started tracking a "last transaction time" metric comparing final sales to clock-outs. Suddenly their labor efficiency numbers made sense.
None of these fixes required new software or complex systems. Just understanding where data should connect, verifying it actually does, and creating simple checks to catch when it doesn't. Total time invested: maybe 10 hours across two weeks. Monthly savings: $3,400. Annual impact: close to $41,000 flowing back to the bottom line.
Your implementation roadmap
Don't try to fix everything at once. Start with daily deposit reconciliation—it's easy to verify and immediately valuable. Spend one week just comparing POS totals to bank deposits. Document every variance. Look for patterns.
-
Week one
Start with daily deposit reconciliation—it's easy to verify and immediately valuable. Spend one week just comparing POS totals to bank deposits. Document every variance. Look for patterns.
-
Week two
Add inventory spot-checks. Pick milk, coffee, and cups. Check theoretical vs actual daily. Don't worry about perfection, just look at the direction and magnitude of drift.
-
Week three
Tackle labor reconciliation. Compare scheduled vs clocked vs productive hours. Calculate sales per labor hour for each shift. Identify your outliers.
-
Week four
Build your ownership matrix. Assign specific reconciliation tasks to specific people. Create simple forms or logs for issue tracking. Set up your weekly review rhythm.
Month two is about automation. Based on what you found manually, identify the three most common failure points. Set up simple alerts for those specific issues. Don't over-engineer it—even basic par level calculations can be automated with spreadsheet formulas before you need anything more complex.
Month three, you're ready for real operational intelligence. You know your normal variance ranges. You can spot anomalies quickly. Your team understands their role in data accuracy. Now you can start using this data to make decisions, not just reconcile numbers.
The tools question
Eventually, manual reconciliation becomes unsustainable. When you're pushing 500+ transactions daily across multiple revenue streams, spreadsheets and spot-checks can't keep up. This is where operational software—particularly platforms with AI-powered anomaly detection—shifts from nice-to-have to necessary.
Modern AI-assisted operational platforms can continuously monitor transaction flows, flag statistical anomalies in real time, and surface patterns that would take a human hours to find. They turn reconciliation from reactive investigation into proactive prevention.
But no software fixes bad underlying processes. If your team doesn't understand why accurate ring-ups matter, if your receiving process is sloppy, if nobody owns reconciliation tasks—software just automates the chaos. Get the manual process working first. Then use technology to scale what already works.
The best implementations layer automation gradually. Start with automated daily reports comparing key metrics. Add anomaly detection for variance outside normal ranges. Then integrate predictive alerts for probable sync failures. Each layer builds on working processes rather than replacing broken ones.
Making reconciliation stick
Cafes that successfully eliminate profit leaks tend to share three characteristics.
They treat reconciliation as prevention, not detection. Every sync failure caught today prevents weeks of compounded errors. Every variance investigated immediately keeps small problems from becoming big ones.
They distribute ownership based on proximity to data, not seniority. The person making the drinks owns modifier accuracy. The person counting tips owns distribution timing. The person seeing all the numbers owns pattern recognition.
They measure variance trends, not just daily discrepancies. A steady 2% variance is fine. A variance growing from 1% to 4% over three months signals process decay.
Your POS, inventory, scheduling, and accounting systems will never achieve perfect sync. But with the right framework—daily checks, weekly reconciliation, clear ownership, and simple automation—you can keep the leaks small enough that profits stay where they belong: in your business, not lost in the gaps between systems.
The difference between cafes that grow profitably and those that grow themselves broke often comes down to this: knowing where your data lives, how it should connect, and catching problems while they're still solvable.
The difference between cafes that grow profitably and those that grow themselves broke often comes down to this: knowing where your data lives, how it should connect, and catching problems while they're still solvable.
Ready to brew operational excellence?
Join hundreds of coffee shops using Coffehq to boost efficiency, reduce waste, and elevate customer satisfaction.