

Most cafes don't lose money because their coffee is bad. They lose it because nobody can tell you, on a Tuesday, whether last week's "double points weekend" actually made money or just moved cash around. The espresso shots were pulled, the loyalty app pinged, the gift cards sold — and somewhere in that pile of activity, margin quietly leaked out and nobody noticed for six weeks.
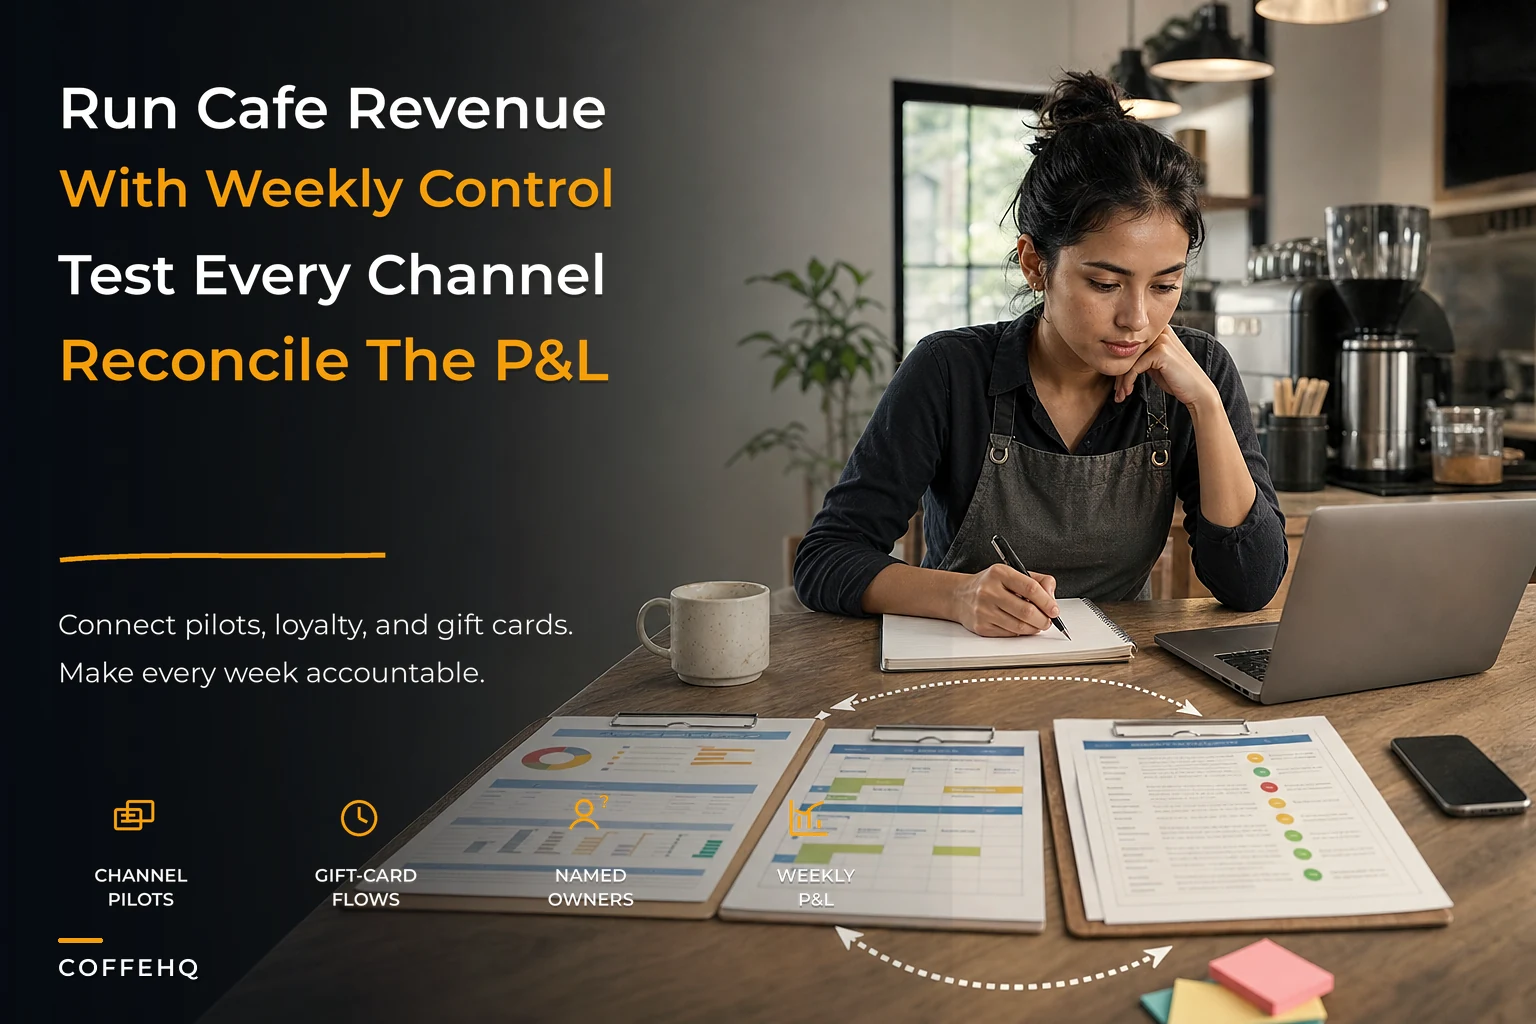
That gap between activity and confirmed profit is the entire problem this article is about. Running cafe revenue operations well isn't about launching more promotions or stacking more channels. It's about building a tight loop where every revenue experiment ties to a specific P&L line, a specific person who owns the result, and a specific weekly moment where you decide to keep it or kill it.
This is the operator-first version. No consultant frameworks, no quarterly reviews that happen in April for things that broke in January. Just a one-page allocation sheet, an experiment registry, go/no-go thresholds, and a reconciliation checklist you can actually run across one to five sites without a finance team.
Why revenue falls through the cracks between channels
The pattern that shows up in almost every independent cafe that's added more than two revenue channels: each channel gets measured in its own silo, and nobody owns the overlap.
Your POS reports in-store sales. Your loyalty platform reports redemptions. Your gift-card system reports liability and sales separately. Your delivery app sends a weekly payout with fees already netted out. Each of these looks fine on its own dashboard. The trouble is that a single customer transaction can touch three of them at once — a loyalty member pays with a gift card for a discounted drink ordered through the app — and no single report tells you what that transaction actually netted.
In real operations, this shows up as a slow drift. A cafe runs a loyalty promo, sees transaction count climb, feels good, keeps it going. Meanwhile the effective discount rate crept from an intended 8% to something closer to 14% because the promo stacked with gift-card bonuses and a happy-hour price. Nobody set out to give away 14%. It just accumulated across systems that weren't talking to each other.
The deeper issue is ownership. When something touches four systems, it's owned by nobody. The manager assumes the owner is watching the P&L. The owner assumes the POS reports are "mostly right." And the gift-card liability — money customers already paid for coffee they haven't drunk yet — sits on the books looking like revenue when it's really a promise you owe.
What actually breaks as you add sites
A single cafe with one manager can run on instinct. The owner is in the building, sees the register, knows roughly what a good day feels like. You can get away with a messy revenue picture because one person holds the whole thing in their head.
Keep every order and shift perfectly aligned.
Coffehq helps you manage orders, inventory, and staff schedules seamlessly.
- Unified order processing
- Real-time inventory updates
- Staff shift coordination
No credit card required
That stops working fast. Here's roughly what breaks at each stage:
| Stage | What still works | What quietly breaks |
|---|---|---|
| 1 site | Owner-in-the-room instinct, mental math | Gift-card liability tracking, true promo cost |
| 2 sites | Shared SOPs, weekly check-ins | Channel attribution, inconsistent discount stacking across sites |
| 3–4 sites | Standardized reporting | Reconciliation lag, "which site's experiment caused the margin dip?" |
| 5 sites | Dedicated ops role | Everything if there's no single allocation sheet and ownership map |
The thing that breaks first — and worst — is attribution. At one site you know the catering order came from the regular who runs the law office down the street. At four sites, you have no idea whether your revenue bump came from the loyalty push, a seasonal pattern, or one location's manager discounting aggressively to hit a sales number.
The second thing that breaks is timing. A single owner reconciles "when they get to it." Across sites, that means a promo that's bleeding margin runs for a month before anyone connects the dots. By then you've trained customers to expect the discount, which makes it twice as painful to pull.
The core idea: one allocation sheet, one weekly cadence
The fix isn't more dashboards. It's one page that forces every revenue lever onto the same grid, plus a weekly rhythm that reconciles that page against actual cash.
Three connected documents, a few pages total:
-
The allocation sheet — every channel and experiment, with its target metric and owner
-
The experiment registry — what you're testing, why, and the go/no-go threshold
-
The reconciliation checklist — the weekly ritual that maps it all back to P&L
The point of keeping it to one page per piece is that nobody maintains a 14-tab spreadsheet. Managers maintain things they can see all at once.
The one-page allocation sheet
This is the spine. Every row is a revenue lever. Every column forces a decision you'd otherwise avoid.
A workable layout:
-
Lever/Channel — in-store, mobile app, loyalty, gift cards, catering, subscription, delivery
-
Weekly revenue target — a number, not "grow it"
-
Allowed cost ceiling — max discount %, max fee %, or max COGS % for that lever
-
Actual (last week) — filled in during reconciliation
-
Owner (RACI) — exactly one accountable name
-
Status — green / watch / kill
Here's a simple workflow to visualize.
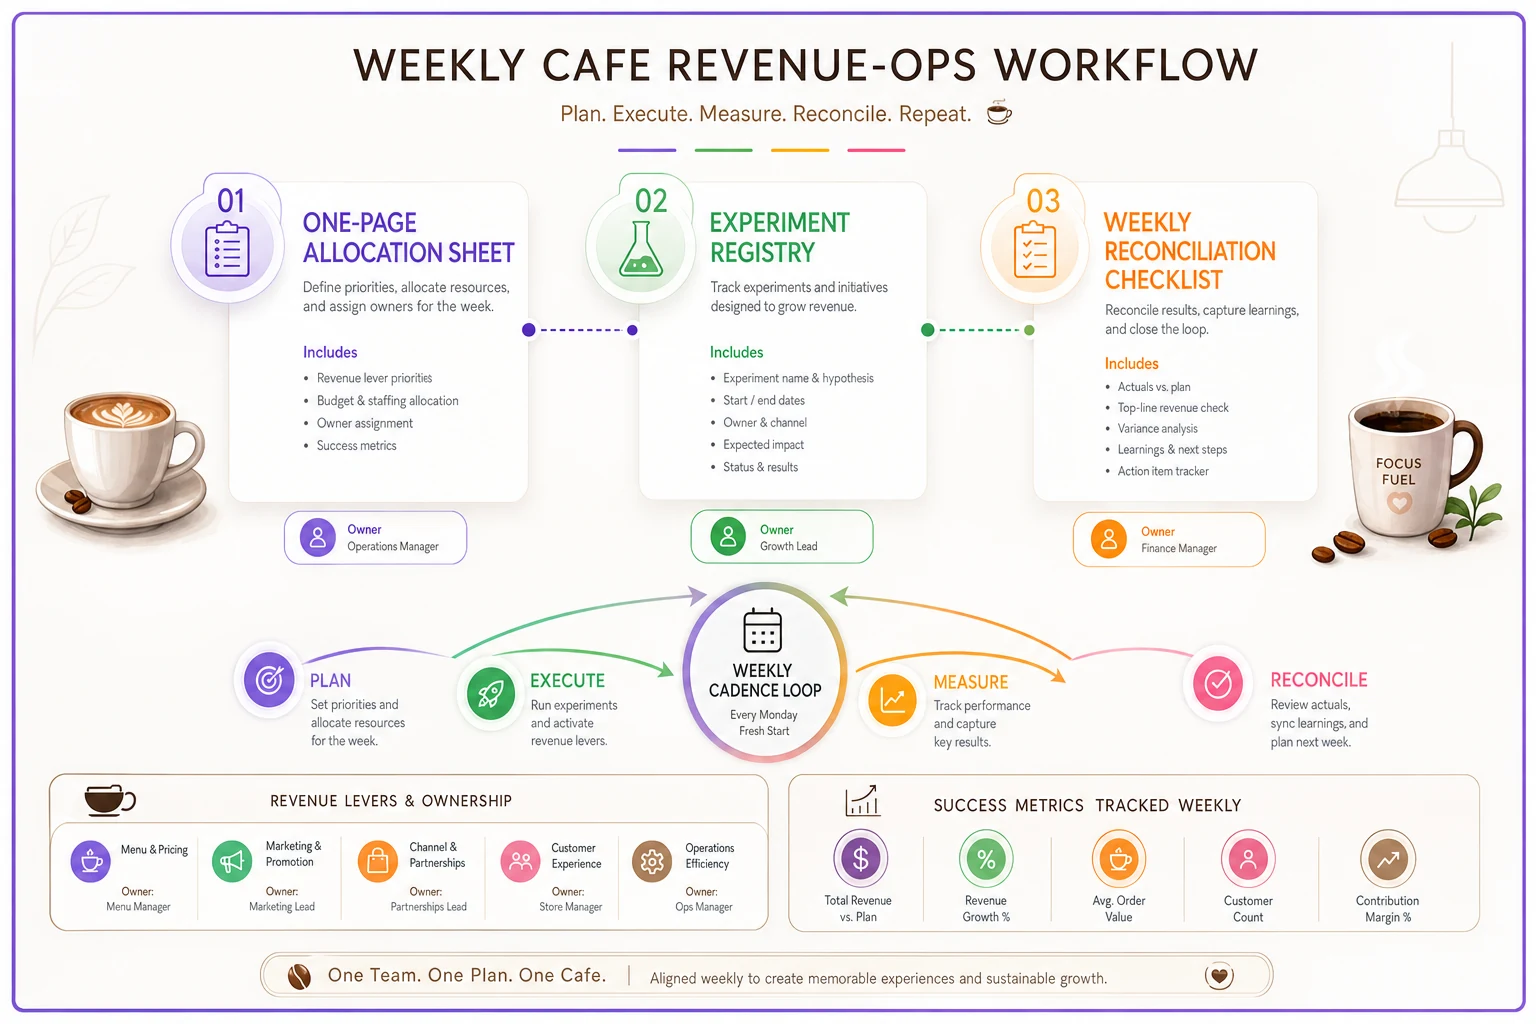
The magic is in the "allowed cost ceiling" column. Most cafes never write down what a loyalty redemption is allowed to cost before it stops being worth it. Once that ceiling exists on paper, the weekly reconciliation becomes a 10-minute pass/fail check instead of a debate.
If you want the deeper logic on how discounting interacts with menu margins — which items you can actually afford to promote and which you can't — the thinking in this menu-engineering and A/B pricing playbook pairs directly with setting those ceilings.
RACI, but the cafe-sized version
"RACI" sounds like corporate overhead for a four-person shop. The useful part is simpler than that: for every number on the allocation sheet, there is exactly one accountable person, and that person isn't always the owner.
-
Responsible — the person who runs the day-to-day (shift lead, barista on the app queue)
-
Accountable — the one name on the hook for the result (usually a site manager)
-
Consulted — whoever has context (owner for pricing, head barista for throughput)
-
Informed — everyone who needs to know the outcome but isn't deciding
The failure mode is predictable: everything rolls up to the owner, the owner becomes the bottleneck for every decision, and nothing gets killed without them. When you assign a site manager as accountable for the loyalty line's cost ceiling, they stop running promos they can't defend on Friday.
Quick gut-check: if you can't name one person per row, that row is a future leak. Shared accountability is the same as no accountability.
The experiment registry: how you stop running zombie promos
A "zombie promo" is a discount or channel push that's technically still live but nobody remembers why, and nobody's measuring. Cafes accumulate these like loose change in a drawer.
The registry kills zombies by forcing every experiment to be written down with an end condition before it launches. One row per experiment:
-
Experiment name (e.g., "Weekday 2pm loyalty double-points")
-
Hypothesis — "fills the dead 2–4pm window without cannibalizing morning margin"
-
Start date / review date — always a fixed review date, never "ongoing"
-
Primary metric — incremental transactions in the 2–4pm window
-
Guardrail metric — effective discount % must stay under ceiling
-
Go/no-go threshold — the number that decides its fate
-
Owner — the accountable name
The guardrail metric is the part cafes skip and regret. You can hit your primary metric — more afternoon transactions! — while blowing your guardrail with an effective discount sitting at 18% and margin underwater. Both numbers have to clear for an experiment to graduate from "test" to "standing offer."
Go/no-go thresholds that actually work
Thresholds only help if they're specific enough to be boring. Vague ones ("if it's doing well") never trigger a kill decision. Here's the kind of specificity that works:
-
Go (keep & scale) incremental transactions up at least 12–15% in the target window AND effective discount at or under ceiling for two consecutive weeks
-
Watch (hold one more week) primary metric positive but guardrail borderline — one more data point, no longer
-
No-go (kill) guardrail breached in any single week, OR primary metric flat after three weeks
Notice the asymmetry: a guardrail breach kills immediately, but a weak primary metric gets three weeks. That's intentional. Margin damage compounds fast and is hard to walk back. Slow growth is just slow, not dangerous.
Where gift cards and loyalty quietly distort everything
Gift cards and loyalty deserve their own section because they break normal revenue logic in a specific way: they decouple when cash arrives from when the cost hits.
A gift card sold in December is cash today and COGS in February. If you treat the sale as clean revenue in your weekly P&L, you'll overstate December and get blindsided when January and February redemptions arrive carrying real milk, bean, and labor cost against revenue you already "counted." On the allocation sheet, gift-card sales and gift-card redemptions must be two separate rows, with the outstanding balance tracked as liability — money you owe in coffee.
Loyalty distorts differently. The reward is a future discount, so the cost lands on a later transaction than the one that earned it. A member earning points today is building a liability you'll pay next month. If your effective-discount calculation only looks at redemptions in the current week, you'll understate the real cost of the program during periods when members are accumulating faster than they're redeeming.
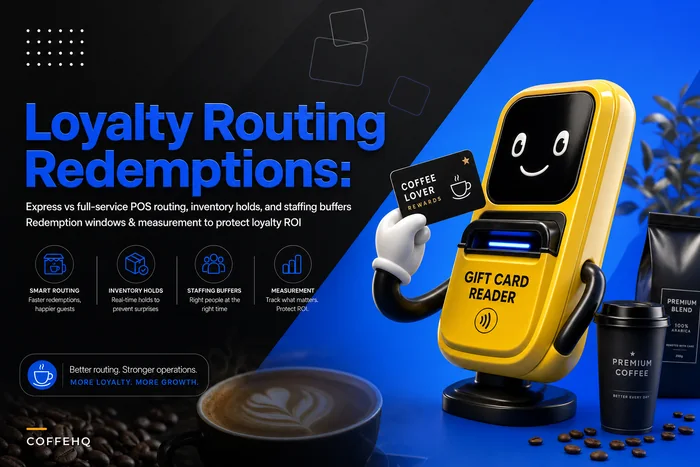
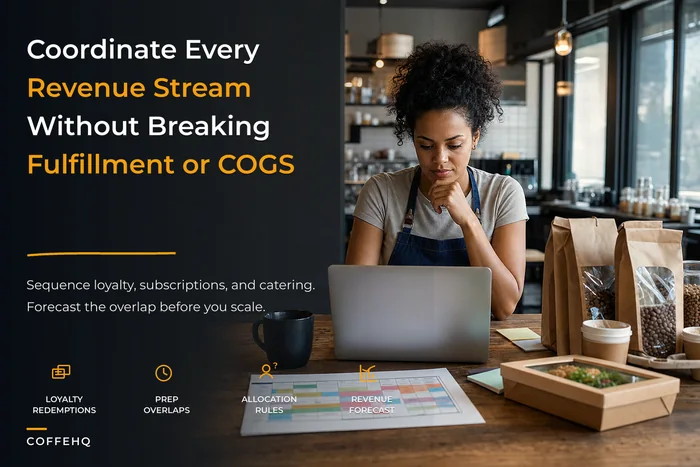
Getting the counter-level mechanics right — so staff aren't guessing and redemptions don't become a free-for-all — is its own discipline. The guardrails in running loyalty and gift-card redemptions without trips to the back handle the operational side, and the broader revenue coordination in coordinating loyalty, subscriptions and catering into predictable revenue connects those pieces into the planning layer. The allocation sheet is where it all lands as numbers.
The weekly reconciliation cadence
This is the heartbeat. Everything above is just paper until there's a fixed weekly moment where someone fills in the "actual" column and makes decisions. Pick a day — most cafes land on Monday or Tuesday, reconciling the prior Monday–Sunday — and make it non-negotiable.
The reconciliation checklist, run per site, roughly 20–30 minutes:
-
Pull total net sales from POS for the week
-
Pull loyalty redemptions; calculate effective discount % against sales
-
Pull gift-card sales AND redemptions separately; update outstanding liability
-
Pull channel payouts (delivery/app) with fees netted — record gross and fee separately
-
Fill "actual" column on the allocation sheet for every live lever
-
Flag any lever above its cost ceiling as watch or kill
-
Update each live experiment's metric and apply go/no-go
-
Confirm one accountable owner has signed off on each flagged row
-
Note any variance over a set dollar threshold and its likely cause
Run the reconciliation on Monday before inventory orders so sign-offs affect ordering.
The sign-off line matters more than it looks. A flag that nobody acknowledges is just a prettier version of the leak you already had.
A simple weekly P&L mapping
| Allocation lever | Maps to P&L line | Weekly check |
|---|---|---|
| In-store sales | Revenue | Net of refunds |
| Loyalty redemptions | Contra-revenue (discount) | Effective % ≤ ceiling |
| Gift-card sales | Liability (not revenue) | Balance growing or shrinking? |
| Gift-card redemptions | Revenue + COGS recognized | Redemption rate trend |
| Delivery/app | Revenue gross; fees as expense | Fee % ≤ ceiling |
| Catering | Revenue; separate COGS tracking | Margin per order |
Mapping it this way means your "we had a great week" feeling and your actual booked profit stop diverging.
A real scenario
A two-site cafe — a neighborhood pair doing somewhere around $18k–$22k combined weekly — had added a loyalty app, gift cards, and a delivery channel over about eighteen months. Revenue looked healthy. The owner's take-home wasn't moving.
When they finally built a one-page allocation sheet, the problem surfaced in one afternoon. The loyalty line had no cost ceiling, and the effective discount had drifted to roughly 13% because staff were manually applying loyalty and honoring gift-card bonus balances on the same tickets. Gift-card sales were being treated as straight revenue, so December looked like a blowout and the owner had ordered inventory accordingly — then got squeezed in January when redemptions hit against a month with soft fresh sales.
The fix wasn't dramatic. They set a loyalty cost ceiling of 9%, split gift cards into sales vs. redemption vs. liability rows, assigned each site manager as accountable for their location's ceilings, and ran the Monday reconciliation. Within about six weeks the effective discount settled near 9%, the January inventory surprise didn't repeat the following year, and — the part that mattered most — the owner could finally say which channel was actually earning its keep. The delivery channel, it turned out, was barely breaking even after fees. They scaled it back and the margin showed up almost immediately.
Nothing about this required new software or a bigger team. It required one page and one fixed hour a week.
When this system makes sense — and when it doesn't
When it makes sense: You're running more than one revenue channel — any combination of loyalty, gift cards, catering, delivery, subscription — or you're operating two or more sites, or you're about to add either. The moment a single transaction can touch multiple systems, you need the allocation sheet.
When it's overkill: A single-site cafe with in-store sales only and no loyalty program doesn't need a registry and a RACI map. The owner-in-the-room method still works. Build the habit of a weekly P&L glance, but don't bureaucratize a business one person can hold in their head.
Who should not do this yet: If your POS data itself is unreliable — refunds miscoded, modifiers not tracked, cash variance you can't explain — fix that first. The allocation sheet is only as honest as the numbers feeding it. Reconciling garbage weekly just gives you confident wrong answers.
Where tooling earns its place
Everything here runs on a spreadsheet and discipline — and for one or two sites, it should. The honest limitation shows up at three-plus sites, where pulling POS, loyalty, gift-card, and channel data by hand every week becomes the thing that quietly doesn't happen.
That's the natural point where AI-powered operational software earns its keep: pulling those feeds into one view, flagging the lever that breached its ceiling before you have to hunt for it, keeping the outstanding gift-card liability current without a manual tally. The value isn't automation for its own sake — it's that the weekly reconciliation still happens reliably when you're not personally in every building. Keep the thinking on paper; let the tooling remove the data-gathering friction that makes operators skip the cadence.
The takeaway for operators
Predictable weekly P&L isn't a reporting problem, it's a loop problem. Activity happens across channels every day; profit only becomes known when every lever lands on one page, gets checked against a ceiling, and has one name attached to the result. The cafes that stay profitable through growth aren't the ones with the cleverest promos — they're the ones who kill a promo on Friday because the number said to, without a meeting about it.
Start with the one-page allocation sheet. Add one real cost ceiling to your loyalty line this week. Run the reconciliation once. You'll likely find at least one leak you didn't know was there — and once it's on the page with an owner next to it, it stops being invisible.
Ready to brew operational excellence?
Join hundreds of coffee shops using Coffehq to boost efficiency, reduce waste, and elevate customer satisfaction.