

Most cafe owners can tell you their total sales down to the penny. Ask them which channel actually makes money after commissions, packaging, and the extra labor it takes to fire a mobile order during the 8:15 rush — and it gets quiet. That gap is where the profit leaks live.
The problem isn't that owners are lazy about numbers. It's that channels blend together in the P&L. A latte sold at the counter, the same latte handed off to a DoorDash driver, and that same latte batched into a 40-cup catering order all show up as "coffee revenue." But they cost wildly different amounts to produce and fulfill. One of them might be losing money on every ticket, and you'd never see it because the winners are covering for the losers.
This is a systems article, not a tips list. The goal is to build a repeatable way to link SKU-level COGS and labor to each channel's pricing and commission structure, run controlled channel experiments, and reconcile it all back into a net-margin-by-channel number you actually trust. That's the whole game of coffee shop channel profitability — knowing, per channel, what's left after everything.
Why channel profit hides so well
A single-location cafe usually starts with one channel: the counter. Everything is simple because everything is the same. COGS is your recipe cost, labor is your barista, and the price on the menu is the price you get.
Then channels stack on. Mobile order-ahead. A delivery app or two. Catering. A wholesale account with the office park down the street. Maybe a subscription program. Each one arrives with its own pricing logic, its own commission or fee, and — this is the part people miss — its own labor signature.
The pattern that tends to break people:
-
Counter looks cheap because you're already staffed for it.
-
Delivery apps look fine on gross revenue but the 15–30% commission plus packaging quietly halves the contribution margin.
-
Catering looks like a jackpot ticket, but it pulls a barista off the line for prep, adds packaging and transport, and often gets priced off gut feeling instead of loaded cost.
The confusion in real operations happens because the POS reports revenue by product, your labor lives in the scheduling app, and commissions show up as a lump deposit from the delivery platform two weeks later. Nothing connects those three. So you're never comparing apples to apples — you're comparing a fully-loaded catering order to a bare counter latte and calling them both "sales."
The tell that you have this problem: total revenue is up but the bank balance feels the same, and you can't explain the mismatch. That usually means a growing channel is dragging margin without anyone noticing.
The building block: SKU-level cost, then channel-loaded cost
You can't allocate what you haven't costed. Before any channel matrix makes sense, you need two numbers per SKU:
Keep every order and shift perfectly aligned.
Coffehq helps you manage orders, inventory, and staff schedules seamlessly.
- Unified order processing
- Real-time inventory updates
- Staff shift coordination
No credit card required
-
True COGS — recipe cost including the milk, syrup, cup, lid, and sleeve. Not "roughly a dollar." The actual number.
-
Prep labor — the seconds of skilled labor to make it. A pour-over and a drip coffee are not the same labor SKU even if they're both "coffee."
Then you layer the channel costs on top. This is where most spreadsheets stop too early. A 16oz latte might cost around $1.10 in ingredients and packaging. Sold at the counter at $5.25, that's healthy. Push the same latte through a delivery app taking 25%, add a $0.40 delivery clamshell and lid upgrade, and suddenly:
-
Menu price on app (marked up to $6.00 to offset)
$6.00
-
Commission (25%)
–$1.50
-
Ingredients + upgraded packaging
–$1.50
-
Net before labor
$3.00
Versus the counter's roughly $4.15 before labor. Same drink, over a dollar of difference in contribution — and that's before accounting for the extra 20–30 seconds of packing labor during peak that slows the whole line and delays in-store customers behind them.
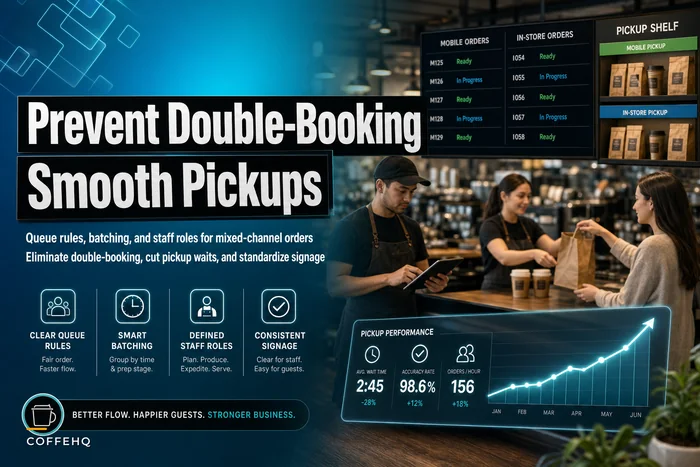
That last point matters more than the commission. Delivery and mobile orders don't just cost their own labor — they impose a throughput tax on every other channel running simultaneously. If you've dealt with the chaos of firing mobile and in-store tickets together, you already know the hidden cost isn't the app fee, it's the pickup delays and queue collisions that ripple through the rush.
The channel-allocation matrix
Once you have loaded per-SKU numbers, you build a matrix that allocates inventory and labor across channels. This is the artifact you'll actually run the business off of. Below is a simplified version for a mid-volume cafe — plug in your own numbers, the structure is what matters.
| Channel | Avg ticket | Commission/fee | Packaging cost/ticket | Extra labor/ticket | Est. net margin % | Peak-hour priority |
|---|---|---|---|---|---|---|
| Counter (in-store) | $8.50 | 0% | $0.30 | baseline | 62–66% | High |
| Mobile order-ahead | $9.20 | ~2% (POS/app) | $0.55 | +20 sec | 52–56% | Medium |
| Delivery app | $11.00 (marked up) | 20–30% | $0.85 | +30 sec | 22–30% | Low |
| Catering | $185 avg order | 0% | $6–12/order | +45–90 min prep | 40–50%* | Scheduled off-peak |
| Wholesale/office standing order | $140/week | 0% | bulk, low | batched, low | 30–38% | Off-peak fulfillment |
*Catering margin swings hard on how you price prep labor. Price it lazily and it can drop under 25%.
Delivery apps rarely deserve peak-hour priority. At 22–30% net, a delivery ticket contributes less than a counter ticket and slows your highest-margin channel. That doesn't mean kill delivery — it means don't let it cannibalize your rush. Some cafes cap delivery availability during their busiest 90 minutes and see counter throughput climb with almost no revenue loss.
Catering and wholesale are labor-timing problems, not pricing problems. They're profitable if prep lands in slow windows. The failure mode is a barista prepping a 60-cup order at 8am while the line backs up. Move that prep to the 2–4pm dead zone and the same order goes from a margin drain to one of your better-contribution channels.
The experiment runbook: testing a channel change without guessing
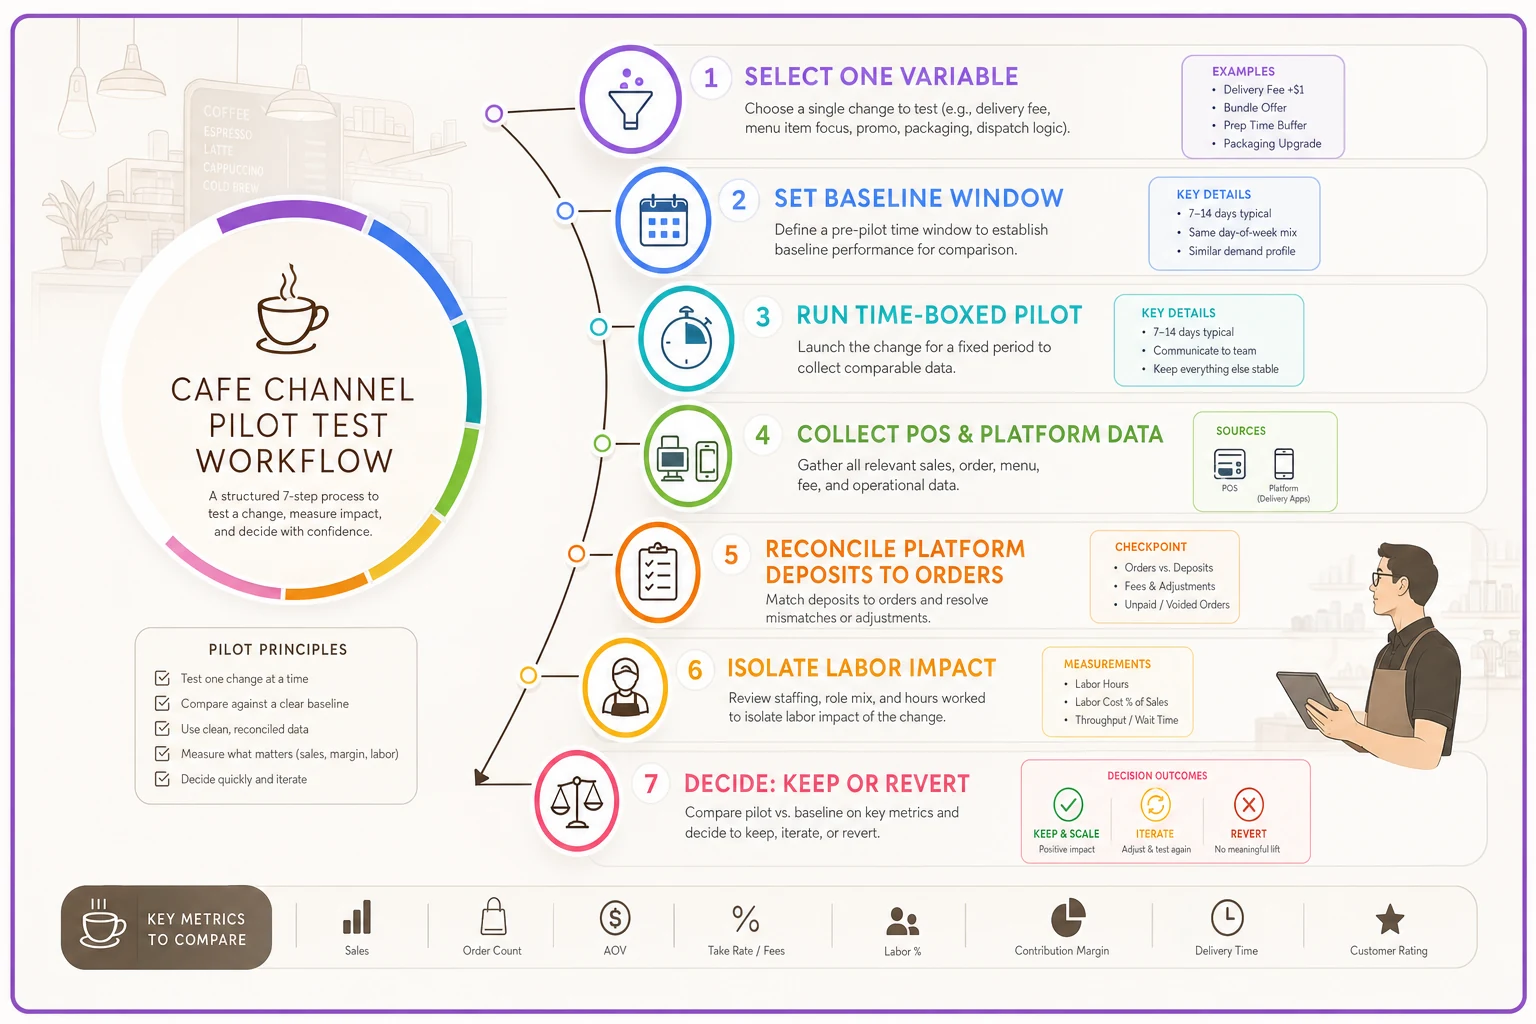
You don't overhaul channels on a hunch. You run small, time-boxed pilots and read the results against a baseline. Here's a runbook that keeps tests honest.
-
Pick one variable. One channel, one lever. "Raise delivery menu prices 8%" or "Restrict delivery during 7:30–9:00am." Not both. If you change two things you'll never know which one moved the number.
-
Set the baseline window. Pull 2–3 weeks of the current state for that channel: order count, average ticket, net margin using your matrix, and — critically — the impact on adjacent channels (did counter wait times change?).
-
Define the pilot length and sample size. Two weeks minimum for delivery and mobile so you catch both weekday and weekend patterns. Catering needs longer because order volume is lumpy — sometimes a full month.
-
Write the kill/keep thresholds before you start. Example: "Keep the delivery price increase if net margin per delivery ticket rises above 32% AND order volume drops less than 15%." Deciding thresholds after you see results is how you fool yourself.
-
Isolate labor effects. Have a manager note peak-hour throughput during the pilot. A pricing win that quietly wrecks line speed isn't a win.
-
Reconcile the pilot against real deposits. Delivery commissions and fees don't hit until later. Don't call a test until the actual platform payout for the pilot period clears and you've matched it to order counts.
-
Decide, document, and roll it into standing operations — or revert cleanly. Whatever you learn, write down the number that drove the decision so the next test starts smarter.
When running a price or availability pilot, brief floor staff to ensure consistent execution during the test window.
Quick visual of the pilot workflow.
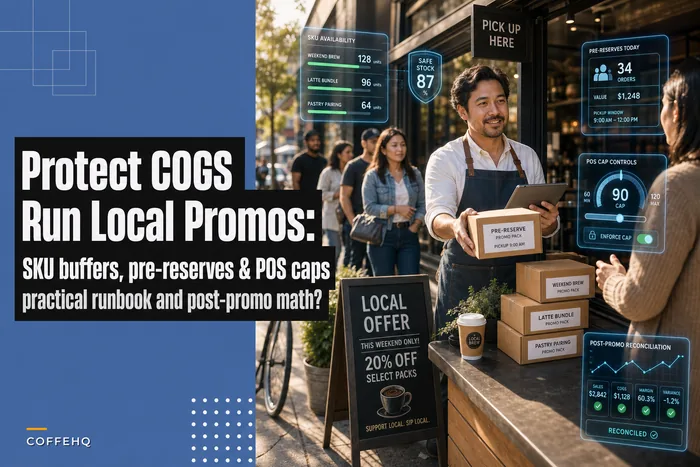
A note on running promos through specific channels: if your pilot involves a discount or bundle, it's easy to blow up COGS in ways the matrix won't catch until later. The discipline in an inventory-aligned promo runbook pairs naturally with channel testing — you want the promo cost and the channel cost visible in the same view.
Measurement cadence and reconciliation
Weekly (15–20 minutes):
-
Pull channel order counts and gross revenue from POS and each platform.
-
Flag any channel where volume moved more than ~20% week over week.
-
Spot-check that packaging inventory draw-down matches delivery/catering volume (a mismatch usually means waste or theft).
Monthly (60–90 minutes):
-
Reconcile every delivery platform deposit against order counts. Platforms adjust, refund, and short you constantly — this is where "phantom revenue" gets caught.
-
Refresh the net-margin-by-channel numbers with actual commission totals, not estimates.
-
Recompute loaded labor per channel if your scheduling or wages changed.
Quarterly:
-
Re-cost your top 15–20 SKUs. Milk, cups, and syrup prices drift and quietly reset every channel's margin.
-
Review whether any channel has crept into peak hours where it doesn't belong.
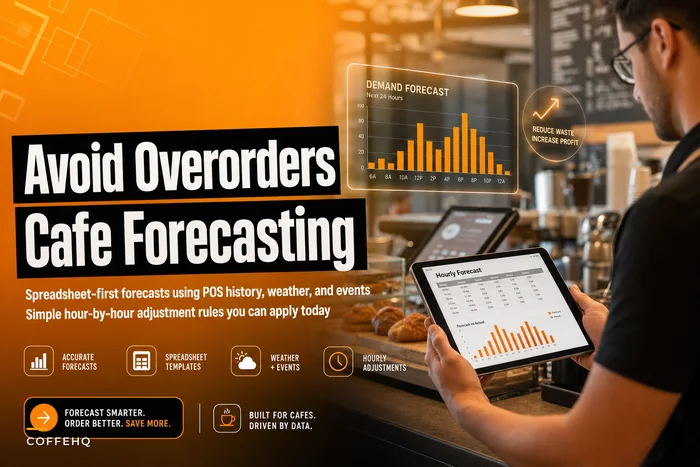
The reconciliation step people skip is matching three sources: what the POS says you sold, what the platform says it paid, and what actually landed in the bank. When those three don't agree — and they often won't — the difference is your real margin leak. A structured forecasting and demand template makes this easier because you're comparing actuals against a prediction instead of a blank page, so anomalies stand out fast.
Reconciliation checklist
Run this before you trust any net-margin-by-channel report:
-
[ ] Every delivery platform payout matched to its order count for the period
-
[ ] Commission and fee lines pulled from actual statements, not assumed percentages
-
[ ] Packaging cost allocated to the channels that actually consumed it
-
[ ] Peak-hour labor split reflects real coverage, not scheduled hours
-
[ ] Catering/wholesale prep labor booked to those channels, not lumped into general labor
-
[ ] Refunds and platform adjustments deducted from the correct channel
-
[ ] Any active promo or discount cost tagged to the channel it ran on
If you can't check all seven, your channel margins are estimates dressed up as facts.
A real scenario
A single-location cafe doing roughly $42k–$46k a month added two delivery apps during a slow stretch and loved the top-line bump — revenue climbed about 11% in a quarter. But the owner noticed cash wasn't following. When we walked the channel matrix together, delivery was running at roughly 24% net margin while eating peak-hour barista time and pushing counter wait times up by close to a minute during the morning rush.
They ran two pilots. First, they raised delivery menu prices by 9% and switched to a cheaper-but-adequate clamshell. Second, they paused delivery availability from 7:45–9:15am. Over three weeks, delivery order volume dropped about 12% — but net margin per delivery ticket climbed into the low 30s, and counter throughput during the rush recovered noticeably. Net effect: slightly fewer delivery orders, materially more profit from the channel, and a faster line for the customers paying full margin.
Nothing exotic happened. They made the channel costs visible, tested two changes against pre-set thresholds, and reconciled the result against actual deposits instead of the app dashboard.
When this makes sense — and when it doesn't
Do this if you run three or more channels, if revenue is growing but cash isn't, or if you've added delivery or catering in the last year without re-checking margins. The more channels you run, the more the blended P&L hides losers.
Skip the heavy version if you're 95% counter with a trickle of mobile orders. You don't need a five-channel matrix to manage two channels — a monthly glance at mobile margin is enough. Building elaborate measurement for a channel doing 4% of volume is effort better spent elsewhere.
Who should be careful: owners tempted to kill a channel purely on margin percentage. A 28%-margin channel that fills your dead 2–4pm window with orders you'd never otherwise get is incremental profit, even at a lower rate. The matrix tells you the margin; your capacity and timing tell you whether that margin is additive or cannibalizing. Read both together.
Where the tooling actually helps
The reason channel margin stays invisible is mostly mechanical: the data lives in three or four disconnected systems, and stitching it by hand each month is miserable enough that most owners just stop doing it. That's the honest case for operational software that pulls POS sales, platform commissions, packaging inventory, and labor into one view — not because dashboards are exciting, but because reconciliation that used to take a Sunday afternoon becomes something you can actually glance at during the week.
When loaded channel costs update on their own as prices and wages shift, the matrix stays accurate instead of going stale the week after you build it. The point isn't automation for its own sake — it's that a channel-margin number you can actually trust, refreshed without a fight, is the difference between running channels on purpose and hoping the winners keep covering the losers.
If your channel strategy ties into loyalty programs, subscriptions, or standing catering accounts, the same logic extends there — those recurring channels are only predictable revenue if you can see their true margin, which is exactly the thread running through coordinating loyalty, subscriptions and catering into predictable revenue.
Channels are the easiest place for an independent cafe to grow revenue and the easiest place to grow it unprofitably. The fix isn't a spreadsheet you build once and forget — it's a system: SKU-level loaded costs feeding a channel-allocation matrix, small time-boxed experiments with thresholds set in advance, and a reconciliation cadence that matches what you sold to what actually hit the bank.
Do that consistently, and coffee shop channel profitability stops being a mystery you back into at year-end and becomes a number you steer with every week. You'll still run delivery, catering, and everything else — you'll just know which ones to feed, which ones to cap during the rush, and which ones are quietly costing you the good months.
Ready to brew operational excellence?
Join hundreds of coffee shops using Coffehq to boost efficiency, reduce waste, and elevate customer satisfaction.